Humans have never been richer and more numerous — Explainer #1a
Discover the fascinating exponential phenomena that have transformed humanity over the last three centuries

Dear reader,
Did you know that humanity has never been richer? That there have never been so many people living on Earth at the same time? That the average human being has never produced so much wealth?
Even more surprising, if you read this article tomorrow, the day after tomorrow, or the day after that, these three sentences will still be true.
Humanity is currently enjoying an unprecedented level of wealth, and there have never been so many of us living on the planet at the same time.
To illustrate this spectacular phenomenon, I am offering you an exploration of long-term economic and demographic data in a series of four articles.
• Explainer #1b: World major regions.
• Explainer #1c: Focus on a few notable countries, including France and the United States.
• Explainer #1d: Life before the emergence of capitalism.
Humanity has never been richer
As shown in Figure 1, the world GDP (Gross Domestic Product) has grown exponentially over the past two centuries. GDP is an (imperfect, like all measures) measure of the wealth produced over a given period in a given geographical area.
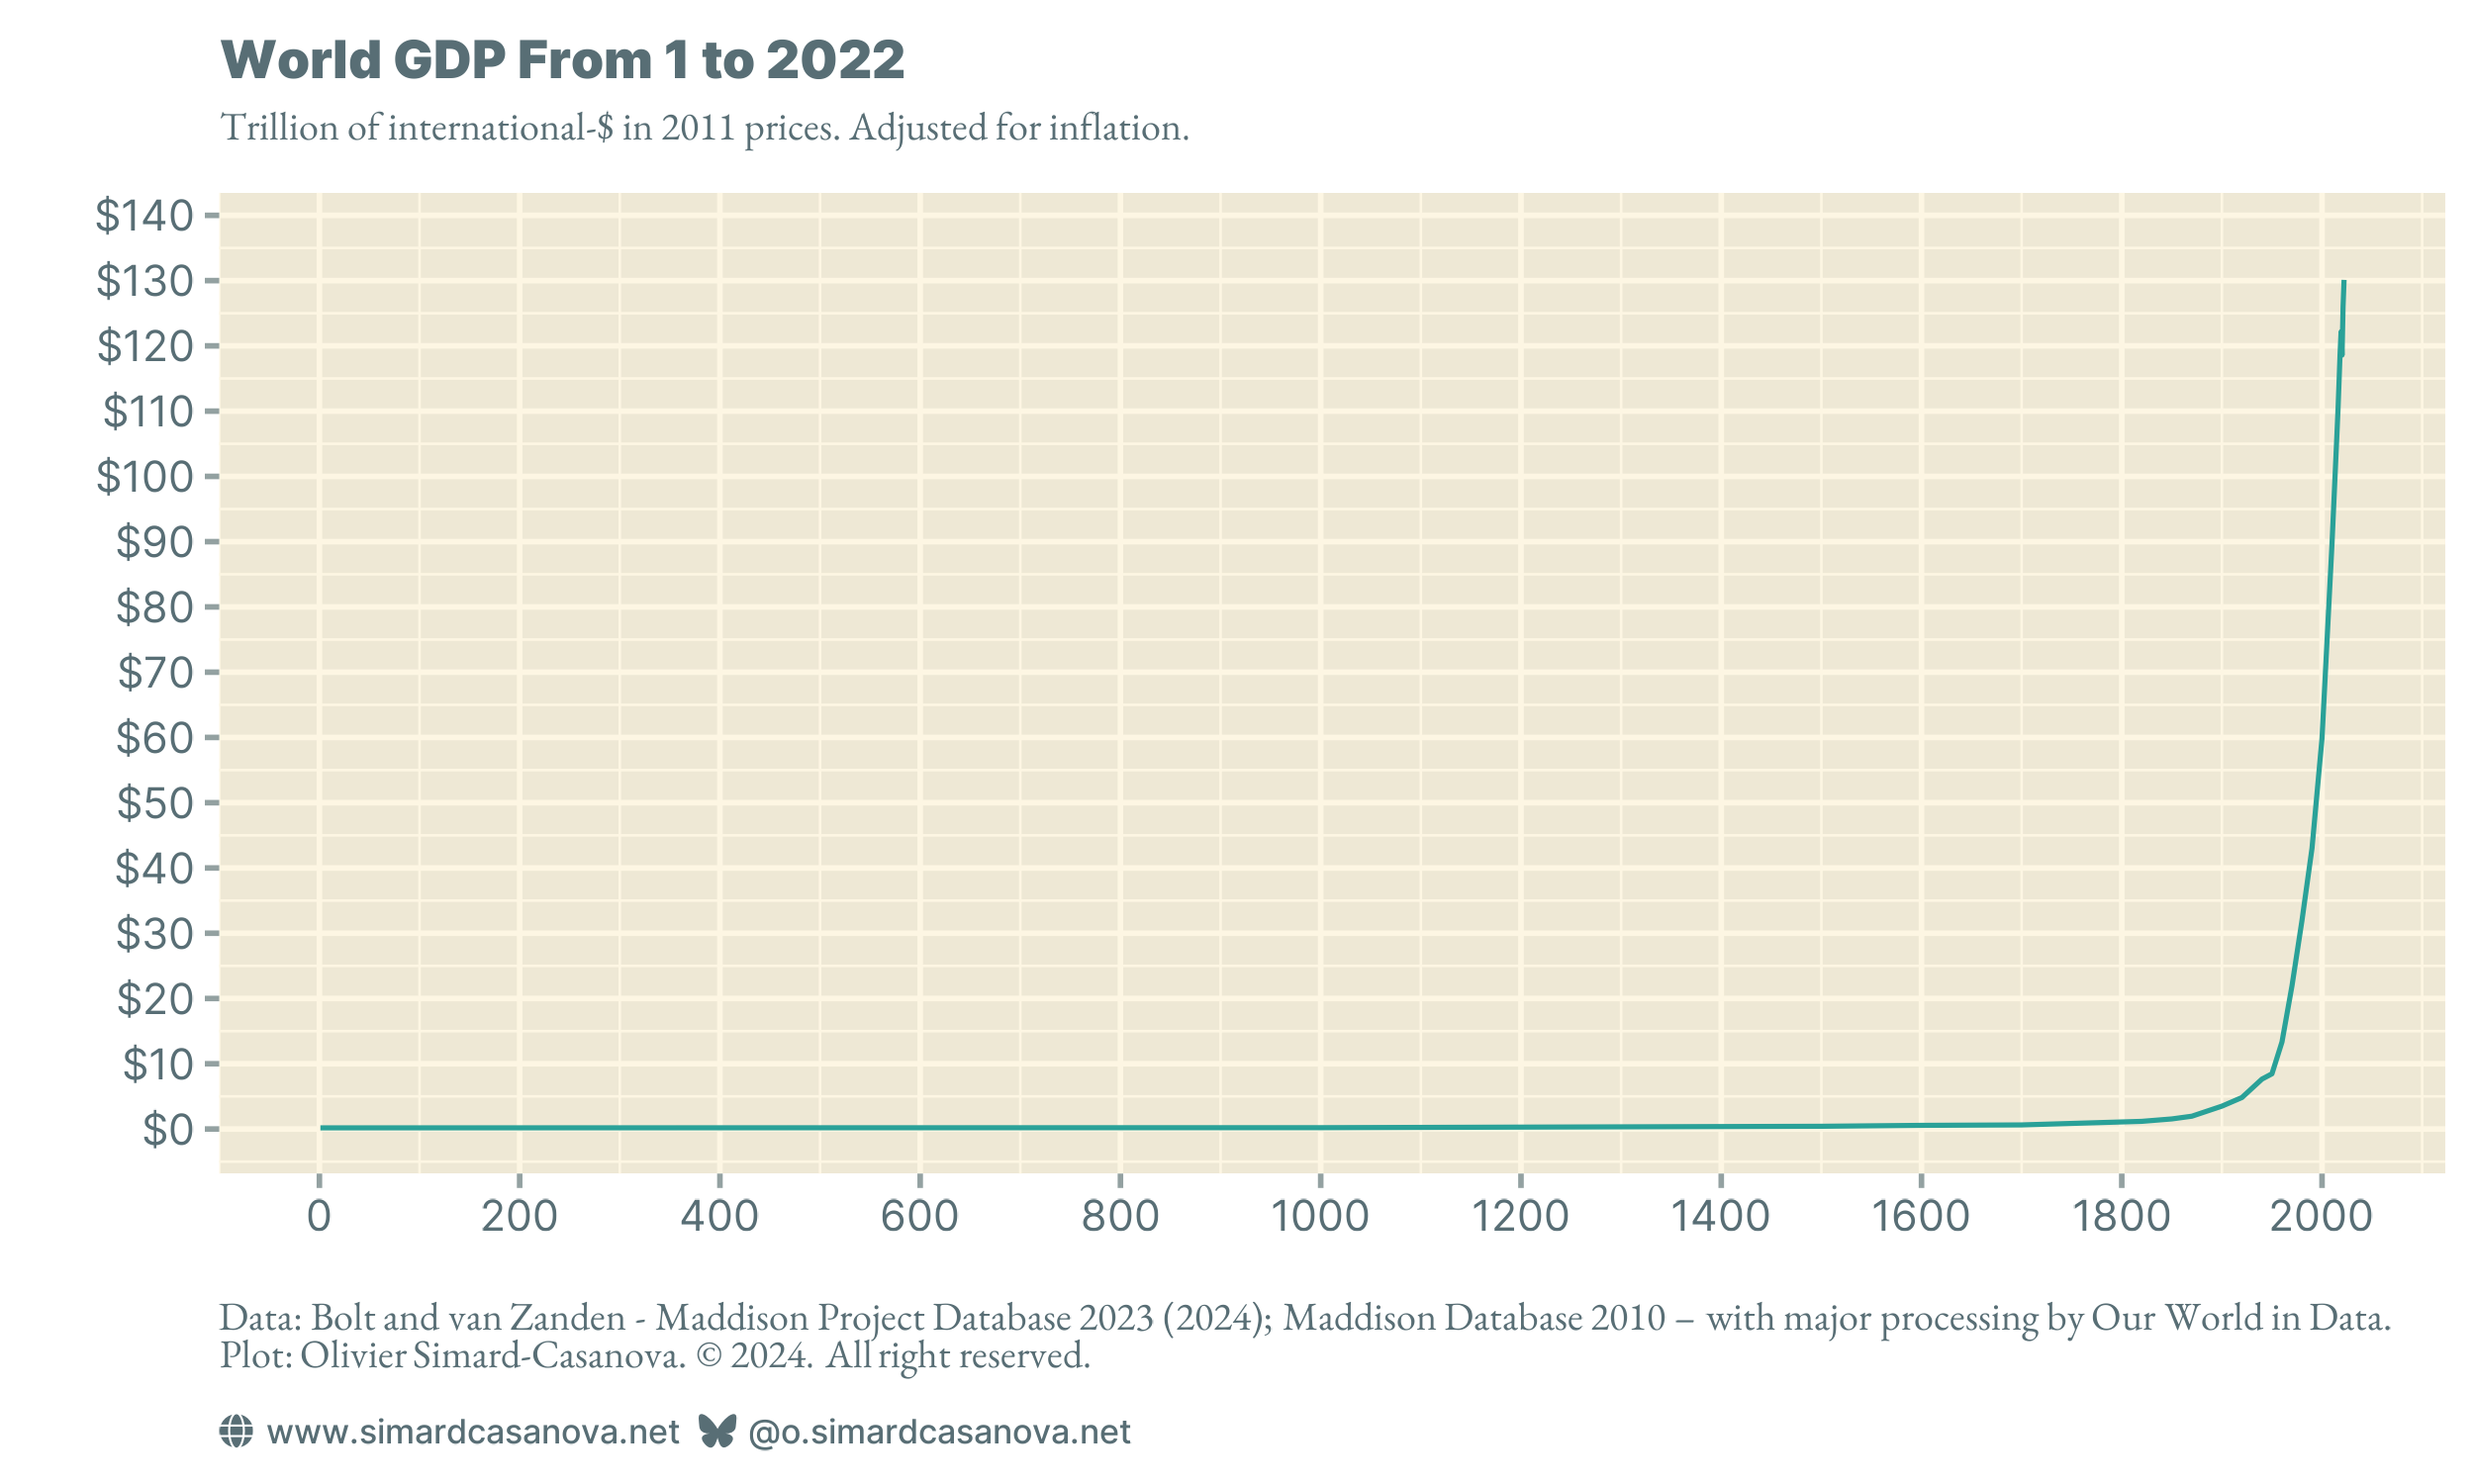
As the rest of the article will show, GDP is not the only statistical series to have grown exponentially over the past two centuries.
Zooming in on the last three centuries, Figure 2 shows that the first phase of GDP growth began in the 19th century, with the First Industrial Revolution and the emergence of capitalism.
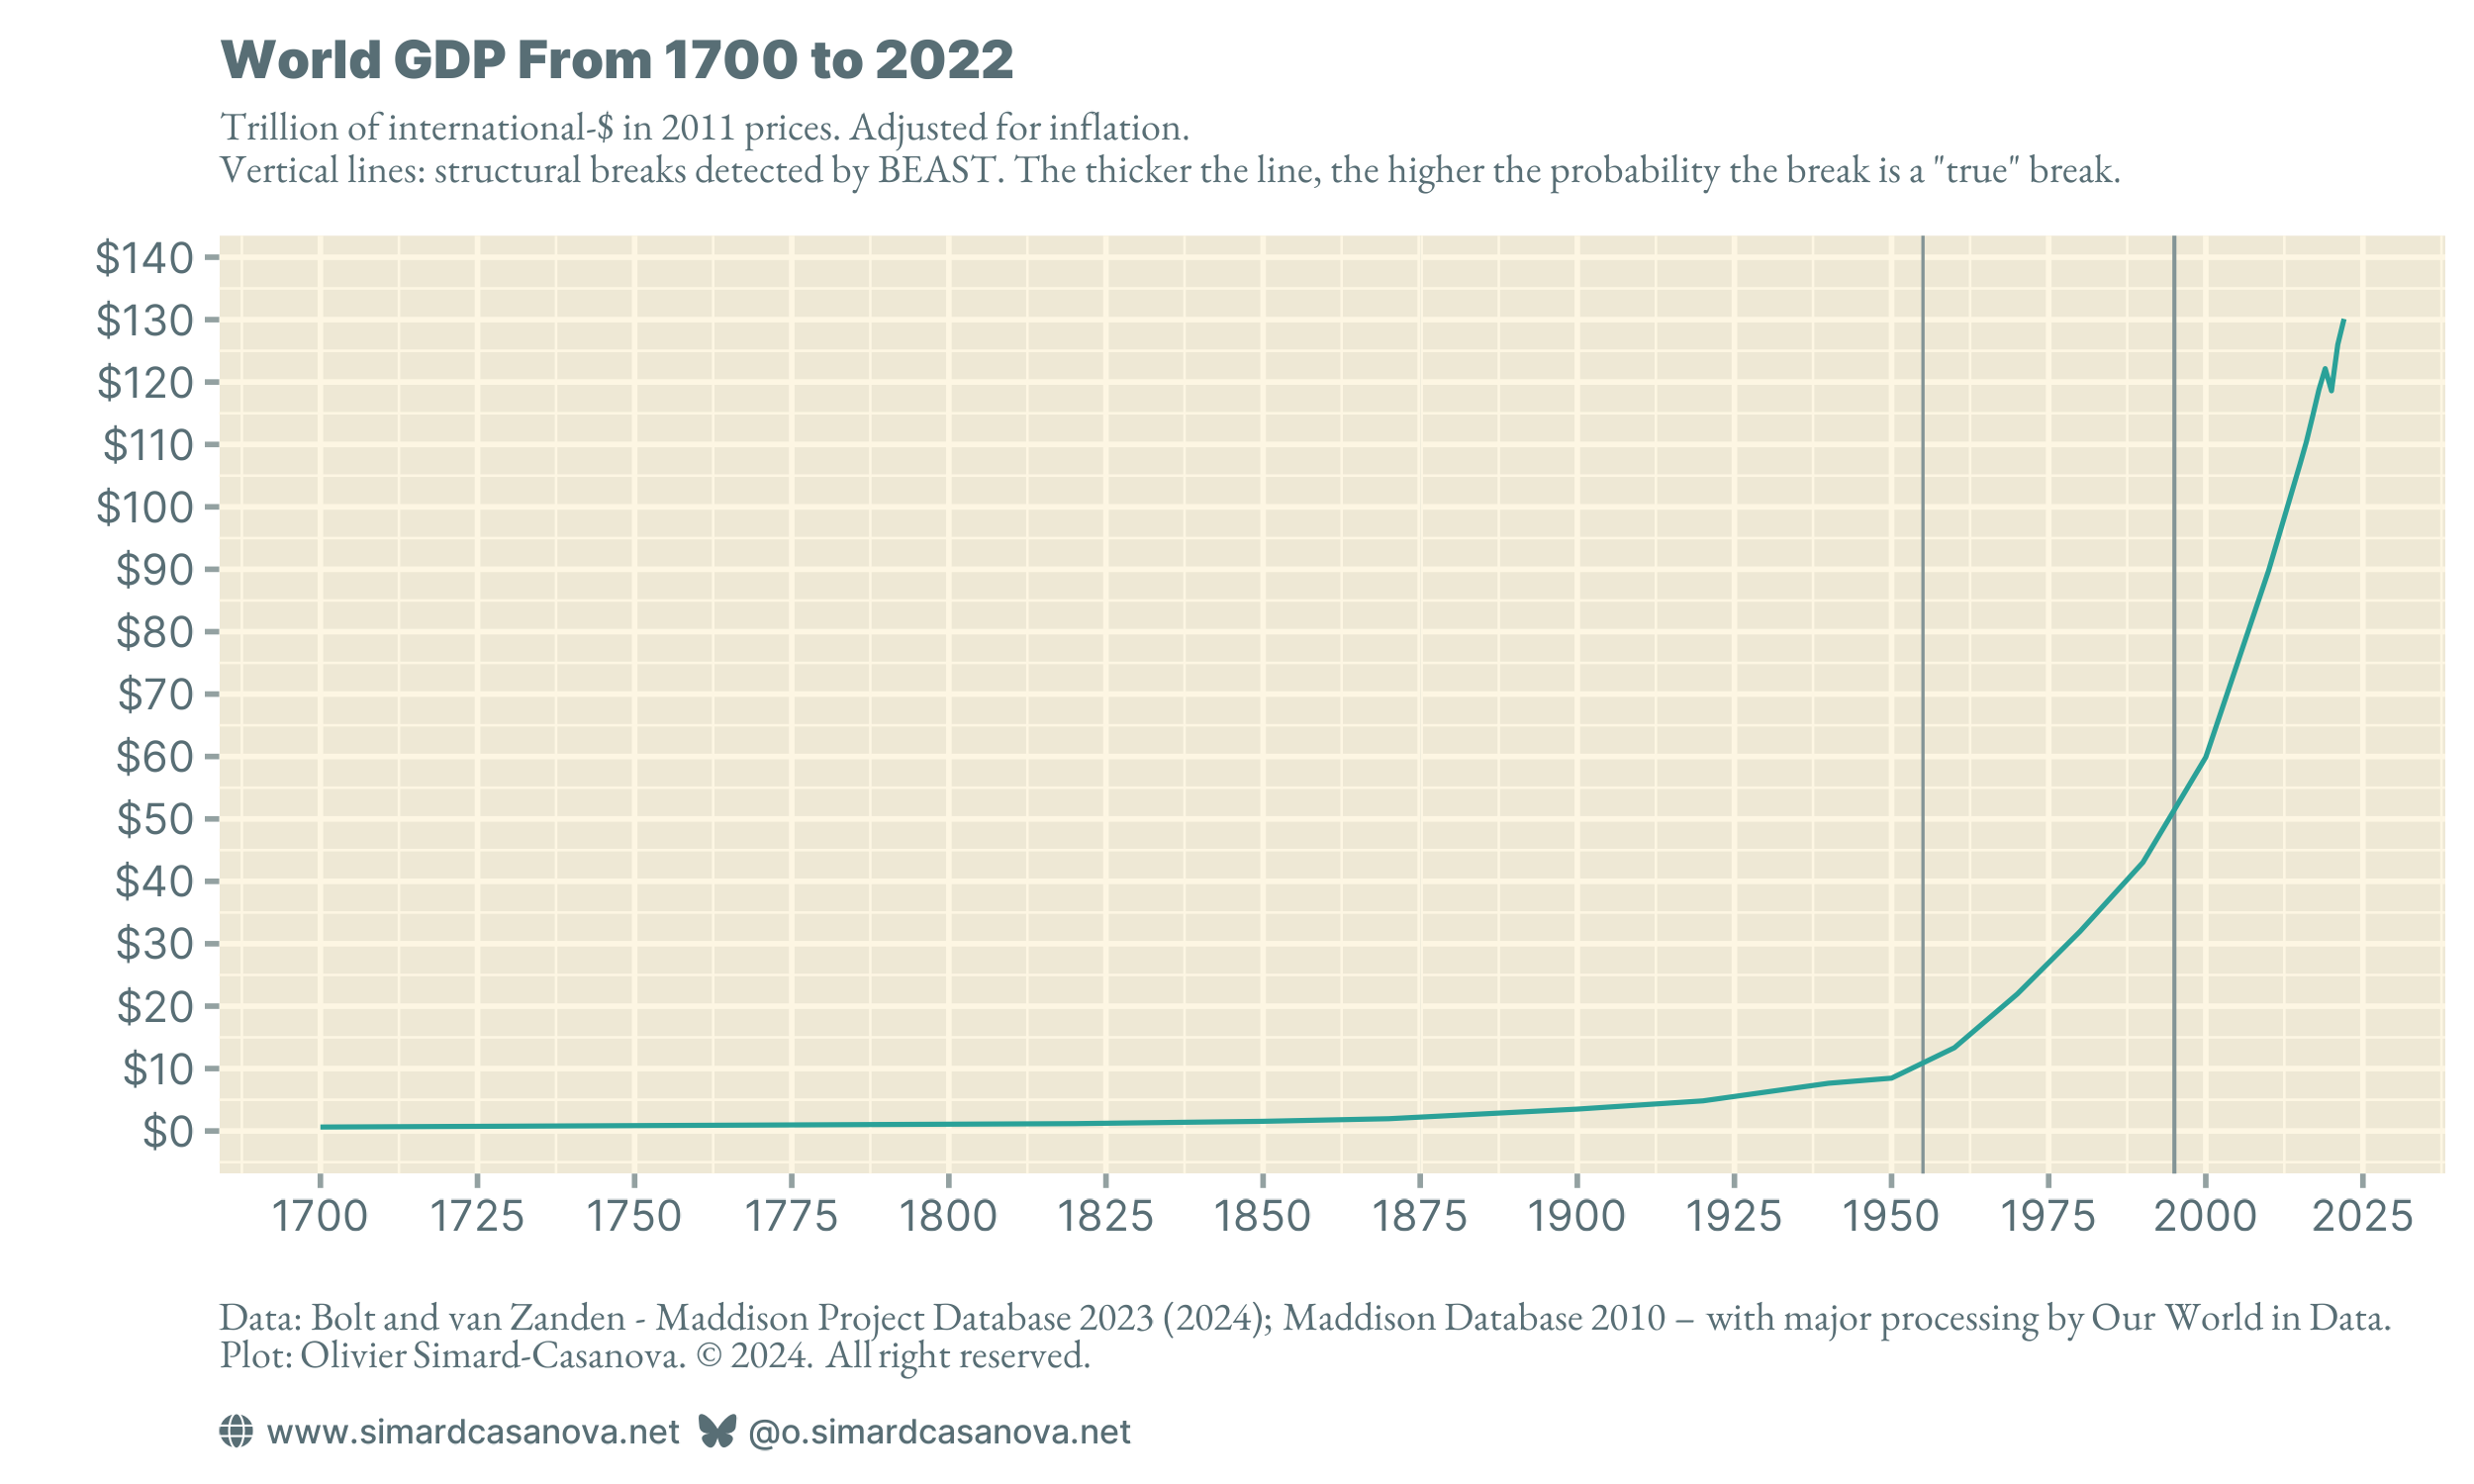
However, it was after the Second World War that the explosive phase of exponential growth began. Today, we are still in this explosive phase.
When did accelerations occur? These accelerations are called structural breaks.
To answer the question, I decided to use a statistical method to detect structural breaks: the Bayesian BEAST estimator. Details about BEAST are provided in a technical appendix available at the end of the article. By applying BEAST to the data in Figure 2 (from 1820 inclusive, with a 5-year interval for estimating the missing observations, see the technical appendix at the end of the article for details), I detect three possible structural breaks:
- 1875, with a probability of 1.8% that the detected break is a “true” break.
- 1955, with a probability of 64.4% that the detected break is a “true” break.
- 1995, with a probability of 79.5% that the detected break is a “true” break.
1955 is the time of the post-war reconstruction in Europe. 1995 saw the acceleration of economic growth in many Asian countries.
The amount of wealth produced each year by humanity is staggering. In 1820, global GDP was around $1.2 trillion, or $1,200 billion. In 2022, it was 130 trillion. In two centuries, global GDP has increased by a factor of almost 110. These figures are so gigantic that they are difficult to grasp.
Humans have never been more numerous
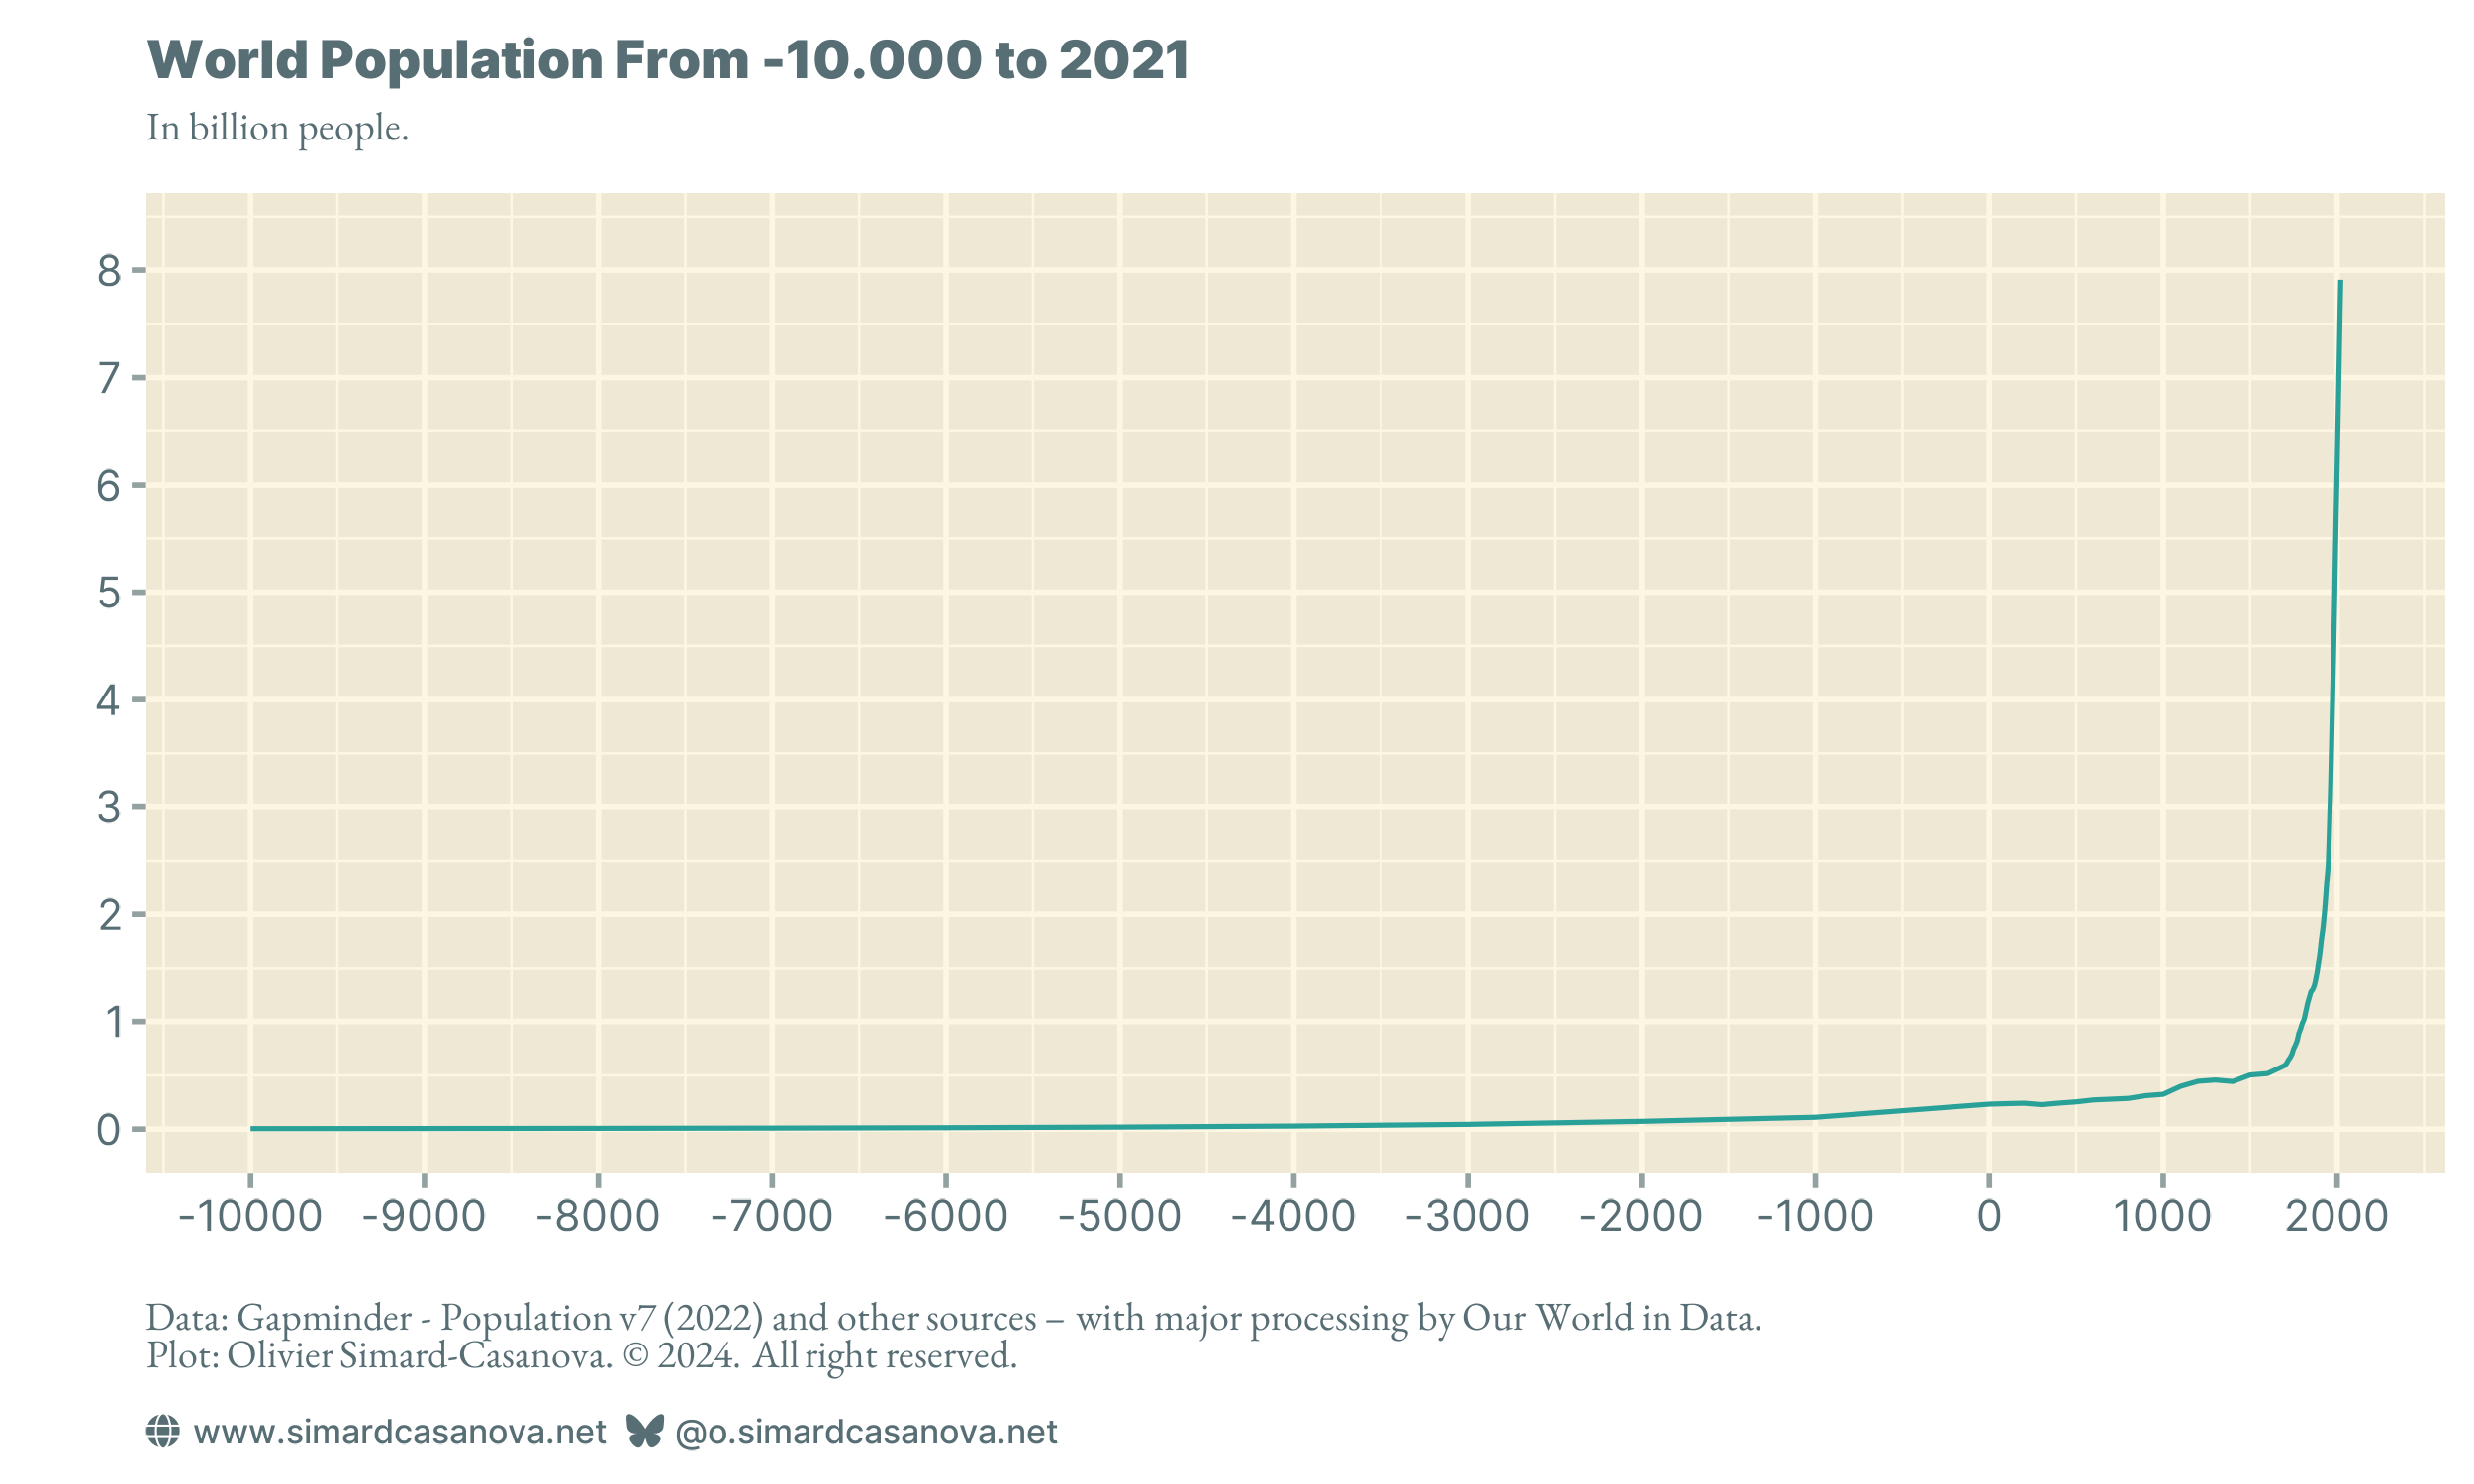
While humanity has never produced so much wealth, at the same time there have never been so many people living on the planet at the same time.
As with GDP, Figure 3 shows that the population has also grown exponentially over the last two centuries.
Zooming in on the last three centuries, Figure 4 shows that population growth has been continuous and linear from the 18th century onwards. As with GDP, it is after the Second World War that population growth accelerated.
BEAST (from 1700 inclusive, with a 1-year interval for estimating the missing observations, see the technical appendix at the end of the article for details) detects multiple structural breaks. The main ones are:
- 1821, with a probability of 27.5% that the detected break is a “true” break.
- 1881, with a probability of 44.2% that the detected break is a “true” break.
- 1922, with a probability of 46.3% that the detected break is a “true” break.
- 1951, with a probability of 96.6% that the detected break is a “true” break.
- 1970, with a probability of 89.3% that the detected break is a “true” break.
One possible interpretation of the first three breaks is the start of the demographic transition in various European countries. The break in the 1950s is visible to the naked eye on the plot and corresponds to the extension of the demographic transition to the rest of the world.
In 1820, the world population was around 1.2 billion people. In 2021, it was almost 8 billion people. In two centuries, the world population has increased by a factor of 6.5.
However, the world population will peak in the coming decades, before starting to decline. As shown in Figure 5, the rate of population growth began to decline as far back as in the 1960s.
Mathematically, the second derivative of the curve has become negative. It is as if the bathtub keeps filling up (the population keeps increasing), but the flow rate of incoming water is slowing down (the percentage increase is increasingly smaller).
BEAST detects the following structural breaks:
- 1958, with a probability of 99.7% that the detected break is a “true” break.
- 1962, with a probability of 99.99% that the detected break is a “true” break.
- 1968, with a probability of a 2% that the detected break is a “true” break.
- 1975, with a probability of 81.1% that the detected break is a “true” break.
- 1991, with a probability of a 90.6% that the detected break is a “true” break.
- 1999, with a probability of a 40% that the detected break is a “true” break.
- 2015, with a probability of a 62% that the detected break is a “true” break.
When the growth rate reaches 0%, the population will stop increasing. When the growth rate becomes negative, the population will start to shrink. This is already the case in several rich countries, such as Japan.
According to various forecasts, the world population could begin to decline by the end of the century. To find out more, you can read this article by Max Roser and Hannah Richie.
The average human has never produced so much wealth
As the population has grown exponentially, it is reasonable to assume that GDP has also grown exponentially. If, each year, each human produces 1,000 euros of wealth, and in two centuries, the number of humans has been multiplied by 6.5, total wealth will (logically) have increased by a factor equivalent to that of the population — i.e., 6.5.
However, we have seen that the growth factors for population and GDP are different. The population grew by a factor of 6.5, while GDP grew by a factor of almost 110. GDP has grown almost 17 times more than the population.
To control, i.e., to neutralize, the effect of population growth on wealth, we use GDP per capita. GDP per capita means dividing GDP by population.
As shown in Figure 6, GDP per capita has also grown exponentially. This is why I can write that the average human has never produced so much wealth.
Zooming in on the last three centuries, Figure 7 shows that there have been two main phases. A first phase of slow increase, starting in the 19th century. This was the First Industrial Revolution and the emergence of capitalism. A second phase of rapid increase, following the Second World War.
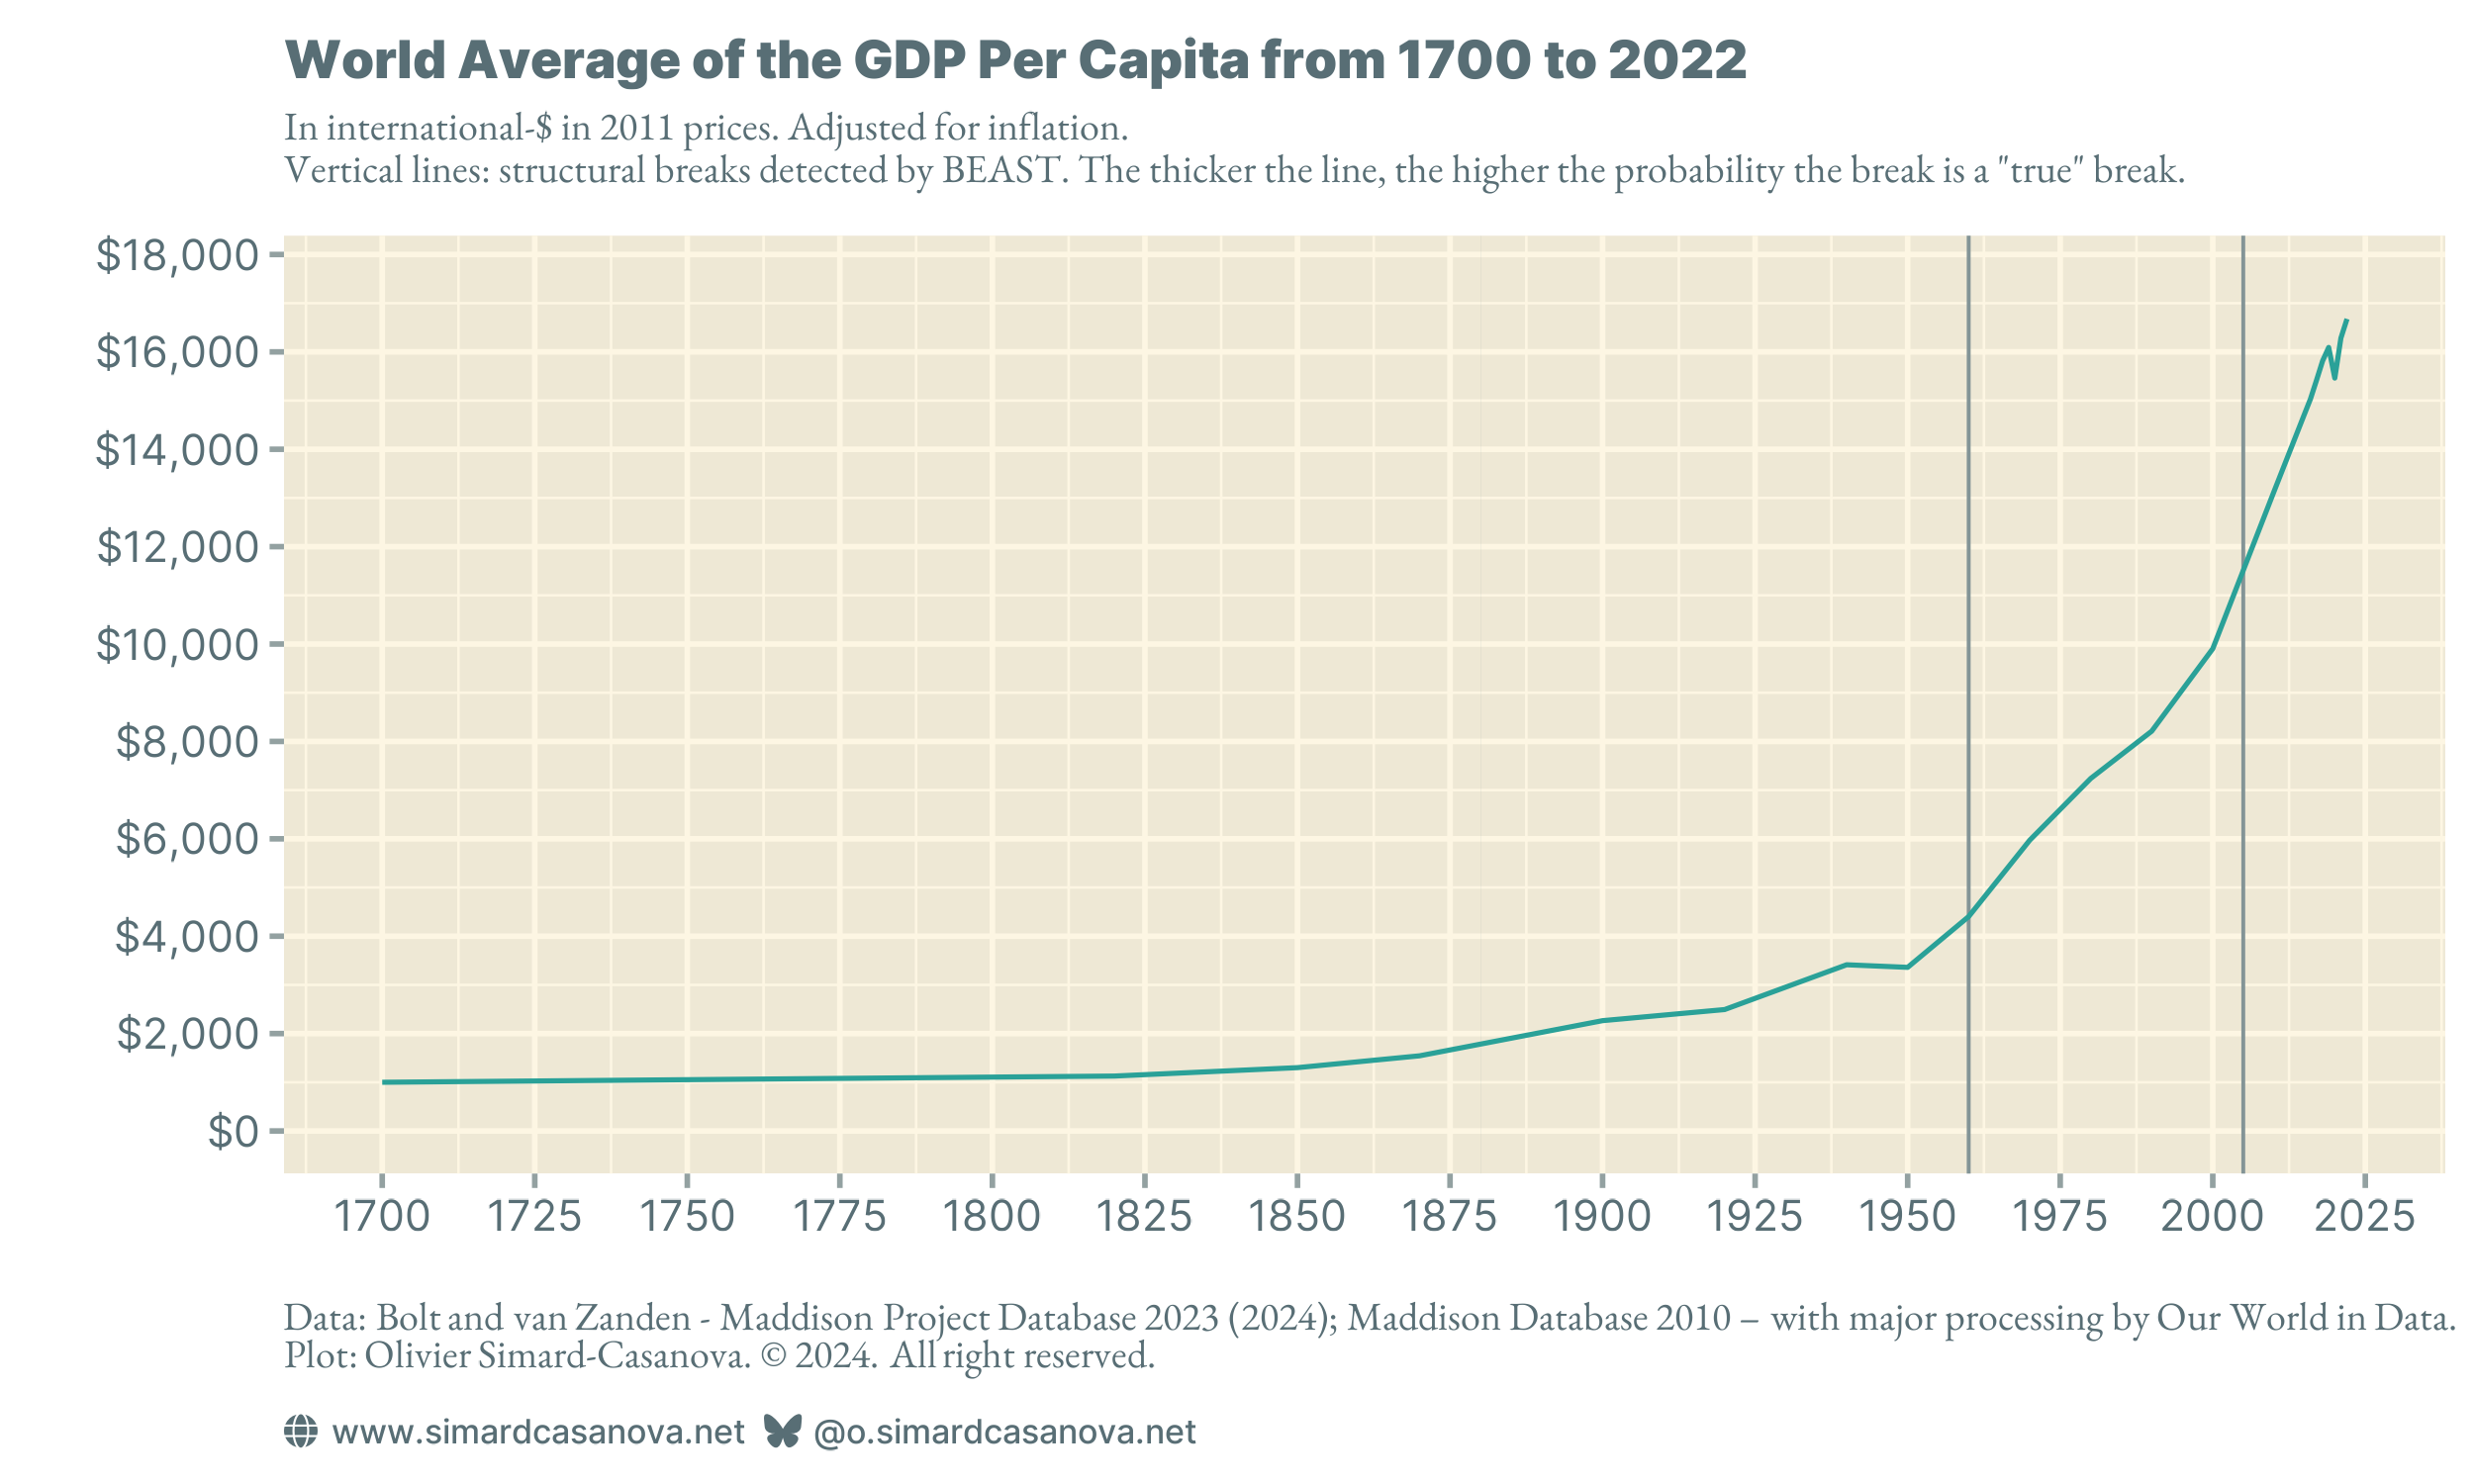
BEAST (from 1820 inclusive, with a 5-year interval for estimating the missing observations, see the technical appendix at the end of the article for details) detects the following structural breaks:
- 1880, with a probability of 1.9% that the detected break is a “true” break.
- 1960, with a probability of 76.1% that the detected break is a “true” break.
- 2005, with a probability of 75.2% that the detected break is a “true” break.
GDP per capita shows a similar pattern to that of GDP. After the Second World War, Europe was rebuilding itself. At the turn of the 2000s, many Asian countries saw their GDP grow significantly.
GDP per capita has risen from around $1,100 a year in 1820 to around $16,500 a year in 2022. In two centuries, the average amount of wealth produced by the average human has increased by a factor of around 16, similar to the factor of almost 17 I mentioned earlier. To put it another way, in the span of two centuries, the average wealth produced by each human living on the planet has multiplied by 16.
If the increase in GDP had been due solely to population growth, the GDP per capita growth factor would have been only 1.
What is responsible for this 16-fold increase in GDP per capita? This is the question that the subfield of economics that studies long-term economic growth is trying to answer. Today's dominant theory, the theory of endogenous growth, shows that long-term economic growth is primarily due to innovation. Largely thanks to innovation, technological but not only, today's average human being produces on average 16 times more wealth than their ancestor did two centuries ago.
Wealth remains unevenly distributed
To say that humanity enjoys today an unprecedented level of wealth does not imply that the wealth is evenly distributed on the planet. Figure 8 shows that, historically, it is primarily Western countries that have experienced an increase in wealth, as measured by GDP per capita.
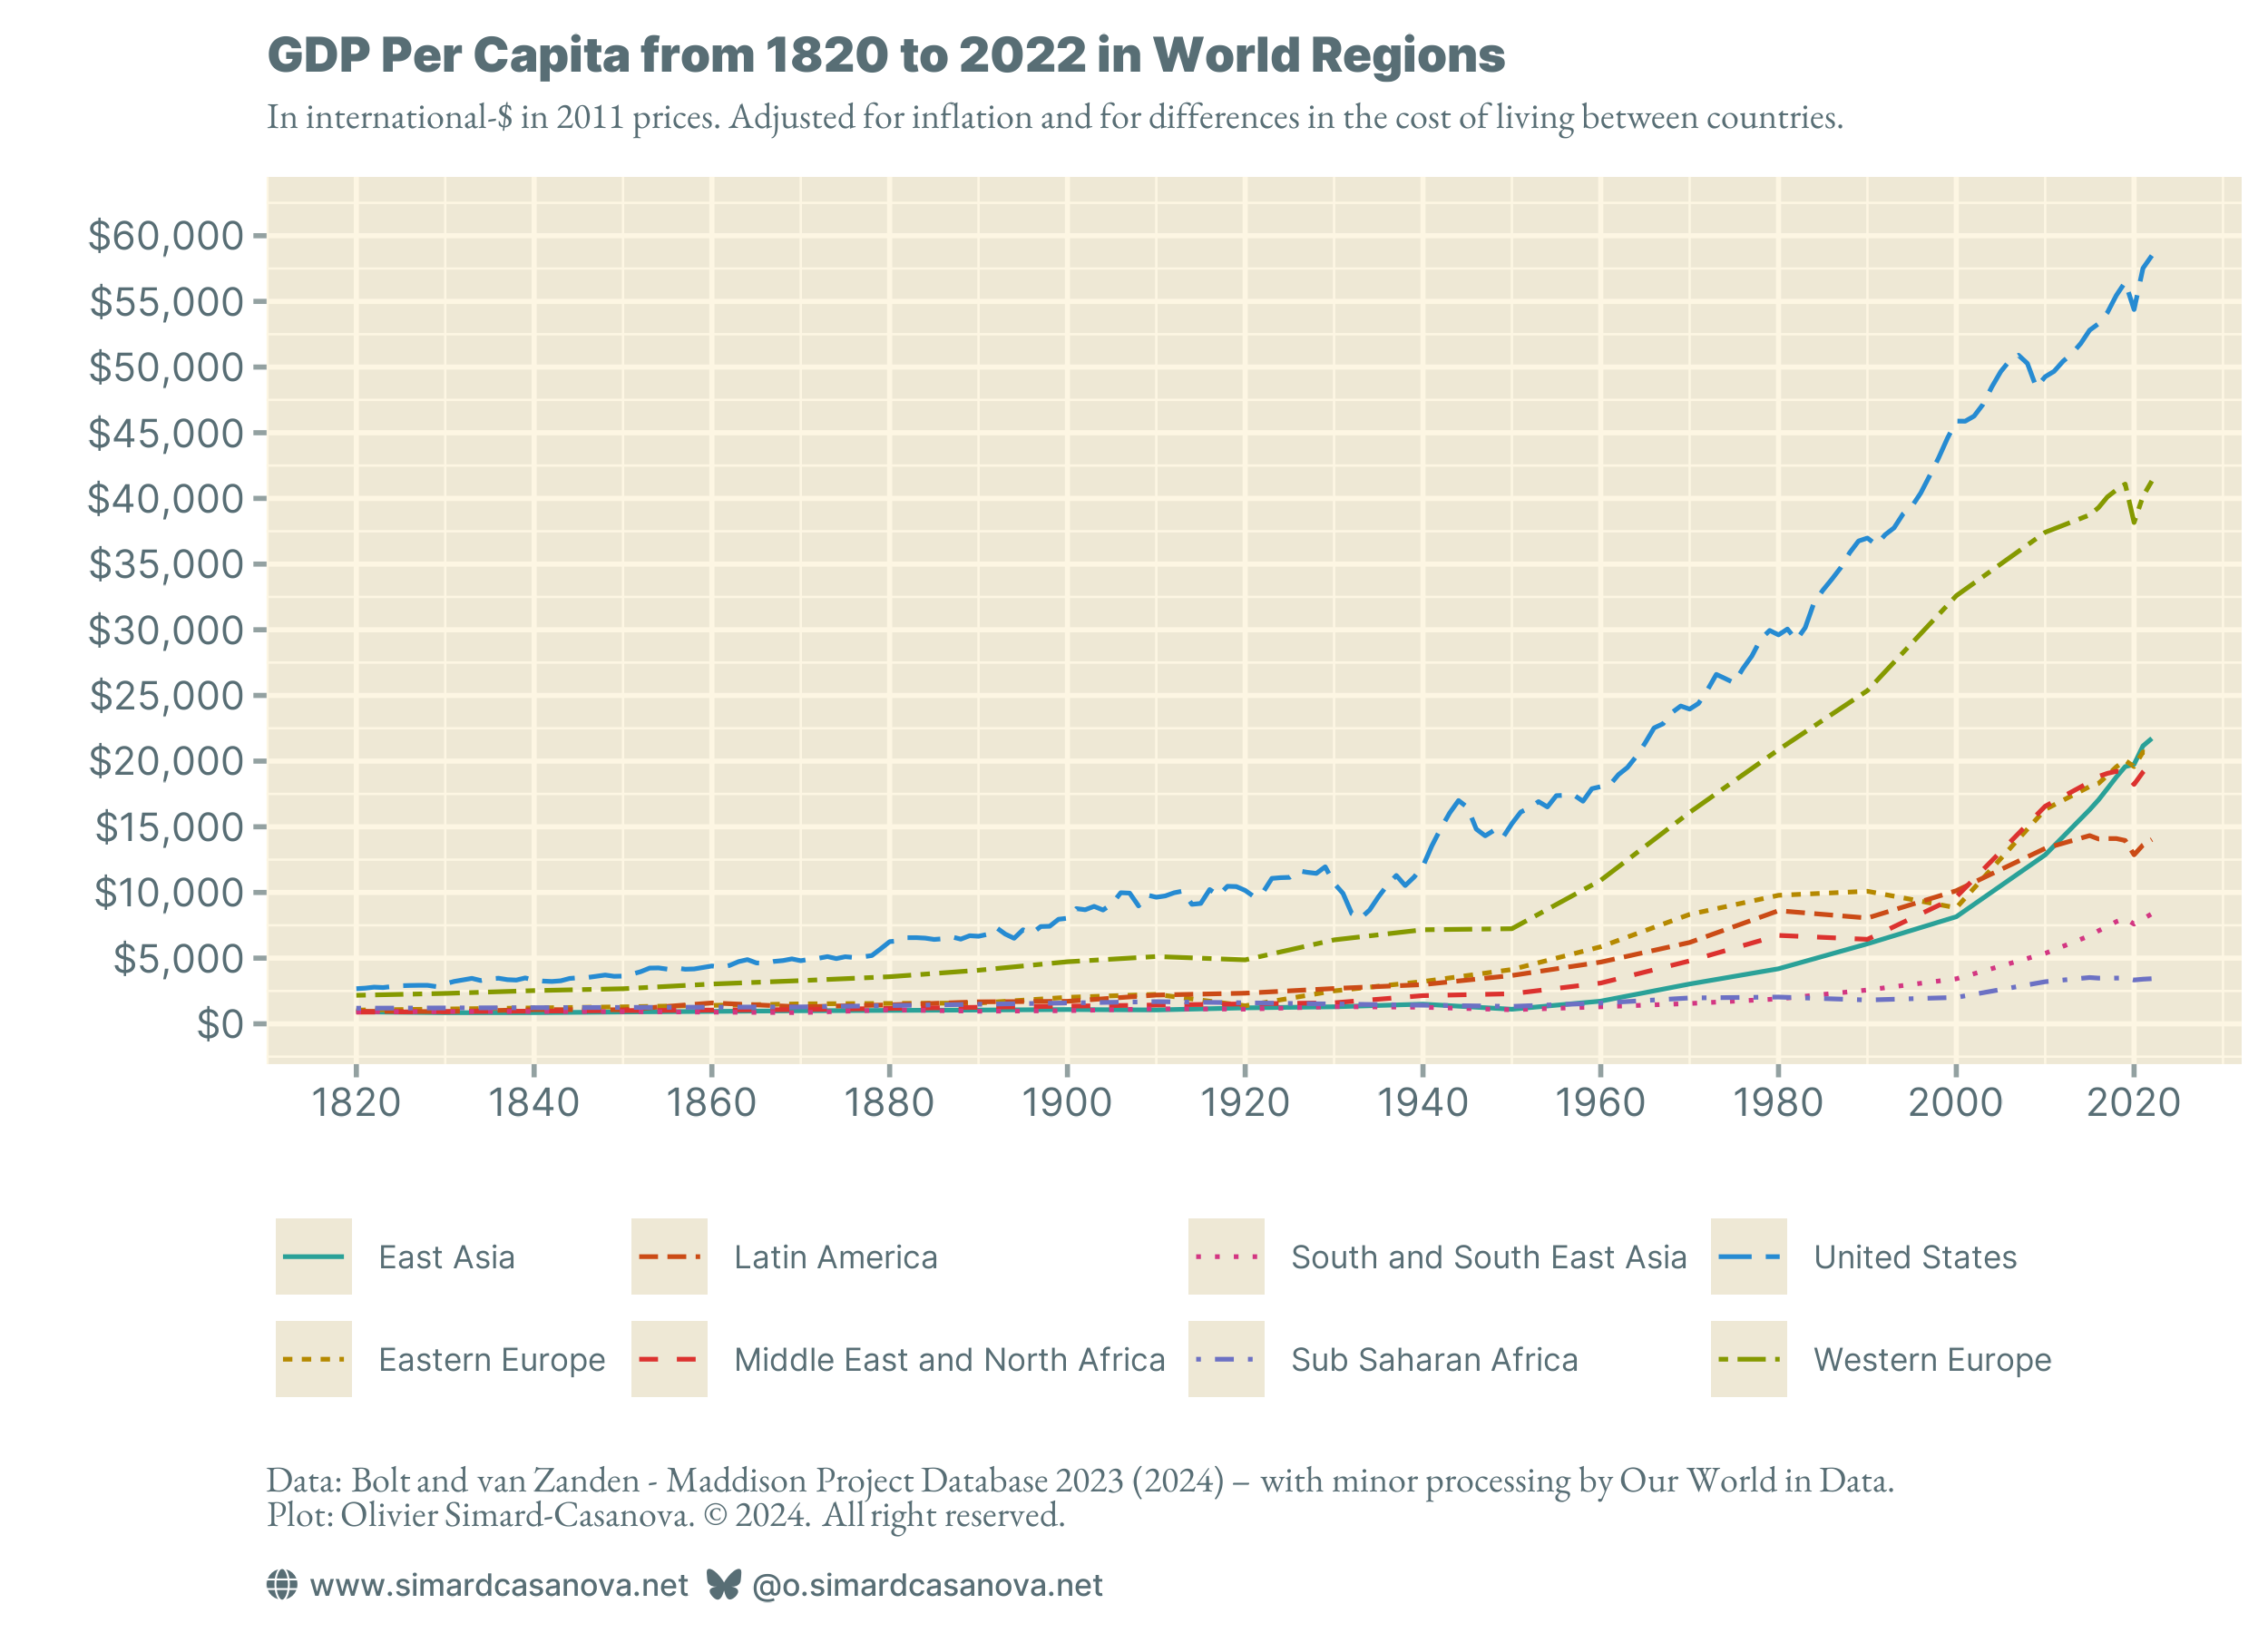
However, since the 1990s, GDP per capita has been rising in all regions of the world.
Economic growth is not a zero-sum game: an increase in GDP per capita in country A does not imply a decrease in GDP per capita in country B. The GDP per capita of both A and B can grow at the same time. As shown in Figure 8, this has been the case for the past several decades. Nevertheless, despite the increase in GDP per capita in most of the world regions, the gap between Western countries and other countries remains significant.
Figure 8 shows averages that say nothing about inequalities within countries. There are inequalities between countries, and there are inequalities within countries. Each can have different dynamics.
Conclusion
The data shows that there have never been so many people on the planet, and they have never been so rich.
This unprecedented wealth is correlated with many social advances, such as access to education, access to healthcare, increased life expectancy, the end of child labor, access to pensions, access to leisure, and so on. This wealth is also correlated with numerous environmental crises, such as global warming, changes in land use, the reduction of biodiversity, and so on.
Humanity has profoundly changed in the past two centuries. Through all these changes, the individual experience of existence has also profoundly changed. Our daily lives bear very little comparison with those of our ancestors just two centuries ago. I'm not sure if we often realize this.
In the next articles in this series, I will be exploring the evolution of GDP per capita in the world major regions (Explainer #1b), in a few notable countries, including France and the United States (Explainer #1c), and I will be exploring what life was like before the emergence of capitalism (Explainer #1d).
To not miss my future articles, you can subscribe to my newsletter.
Did you know about these exponential phenomena? Did you know that a substantial proportion of economic and population growth took place after the Second World War? Did you know that population growth began to slow down several decades ago? Did you know that the average human being's wealth has increased by a factor of 16 over the last two centuries? Did you know that per capita wealth has increased in every region of the world, but that significant disparities persist?
You are welcome to discuss these questions in the comments or by replying by e-mail if you received the article by e-mail.
If you found the article interesting, please share it! Word-of-mouth plays a key role in making my work known.
See you soon for the next article in the series,
Olivier