Guess The Plot #1
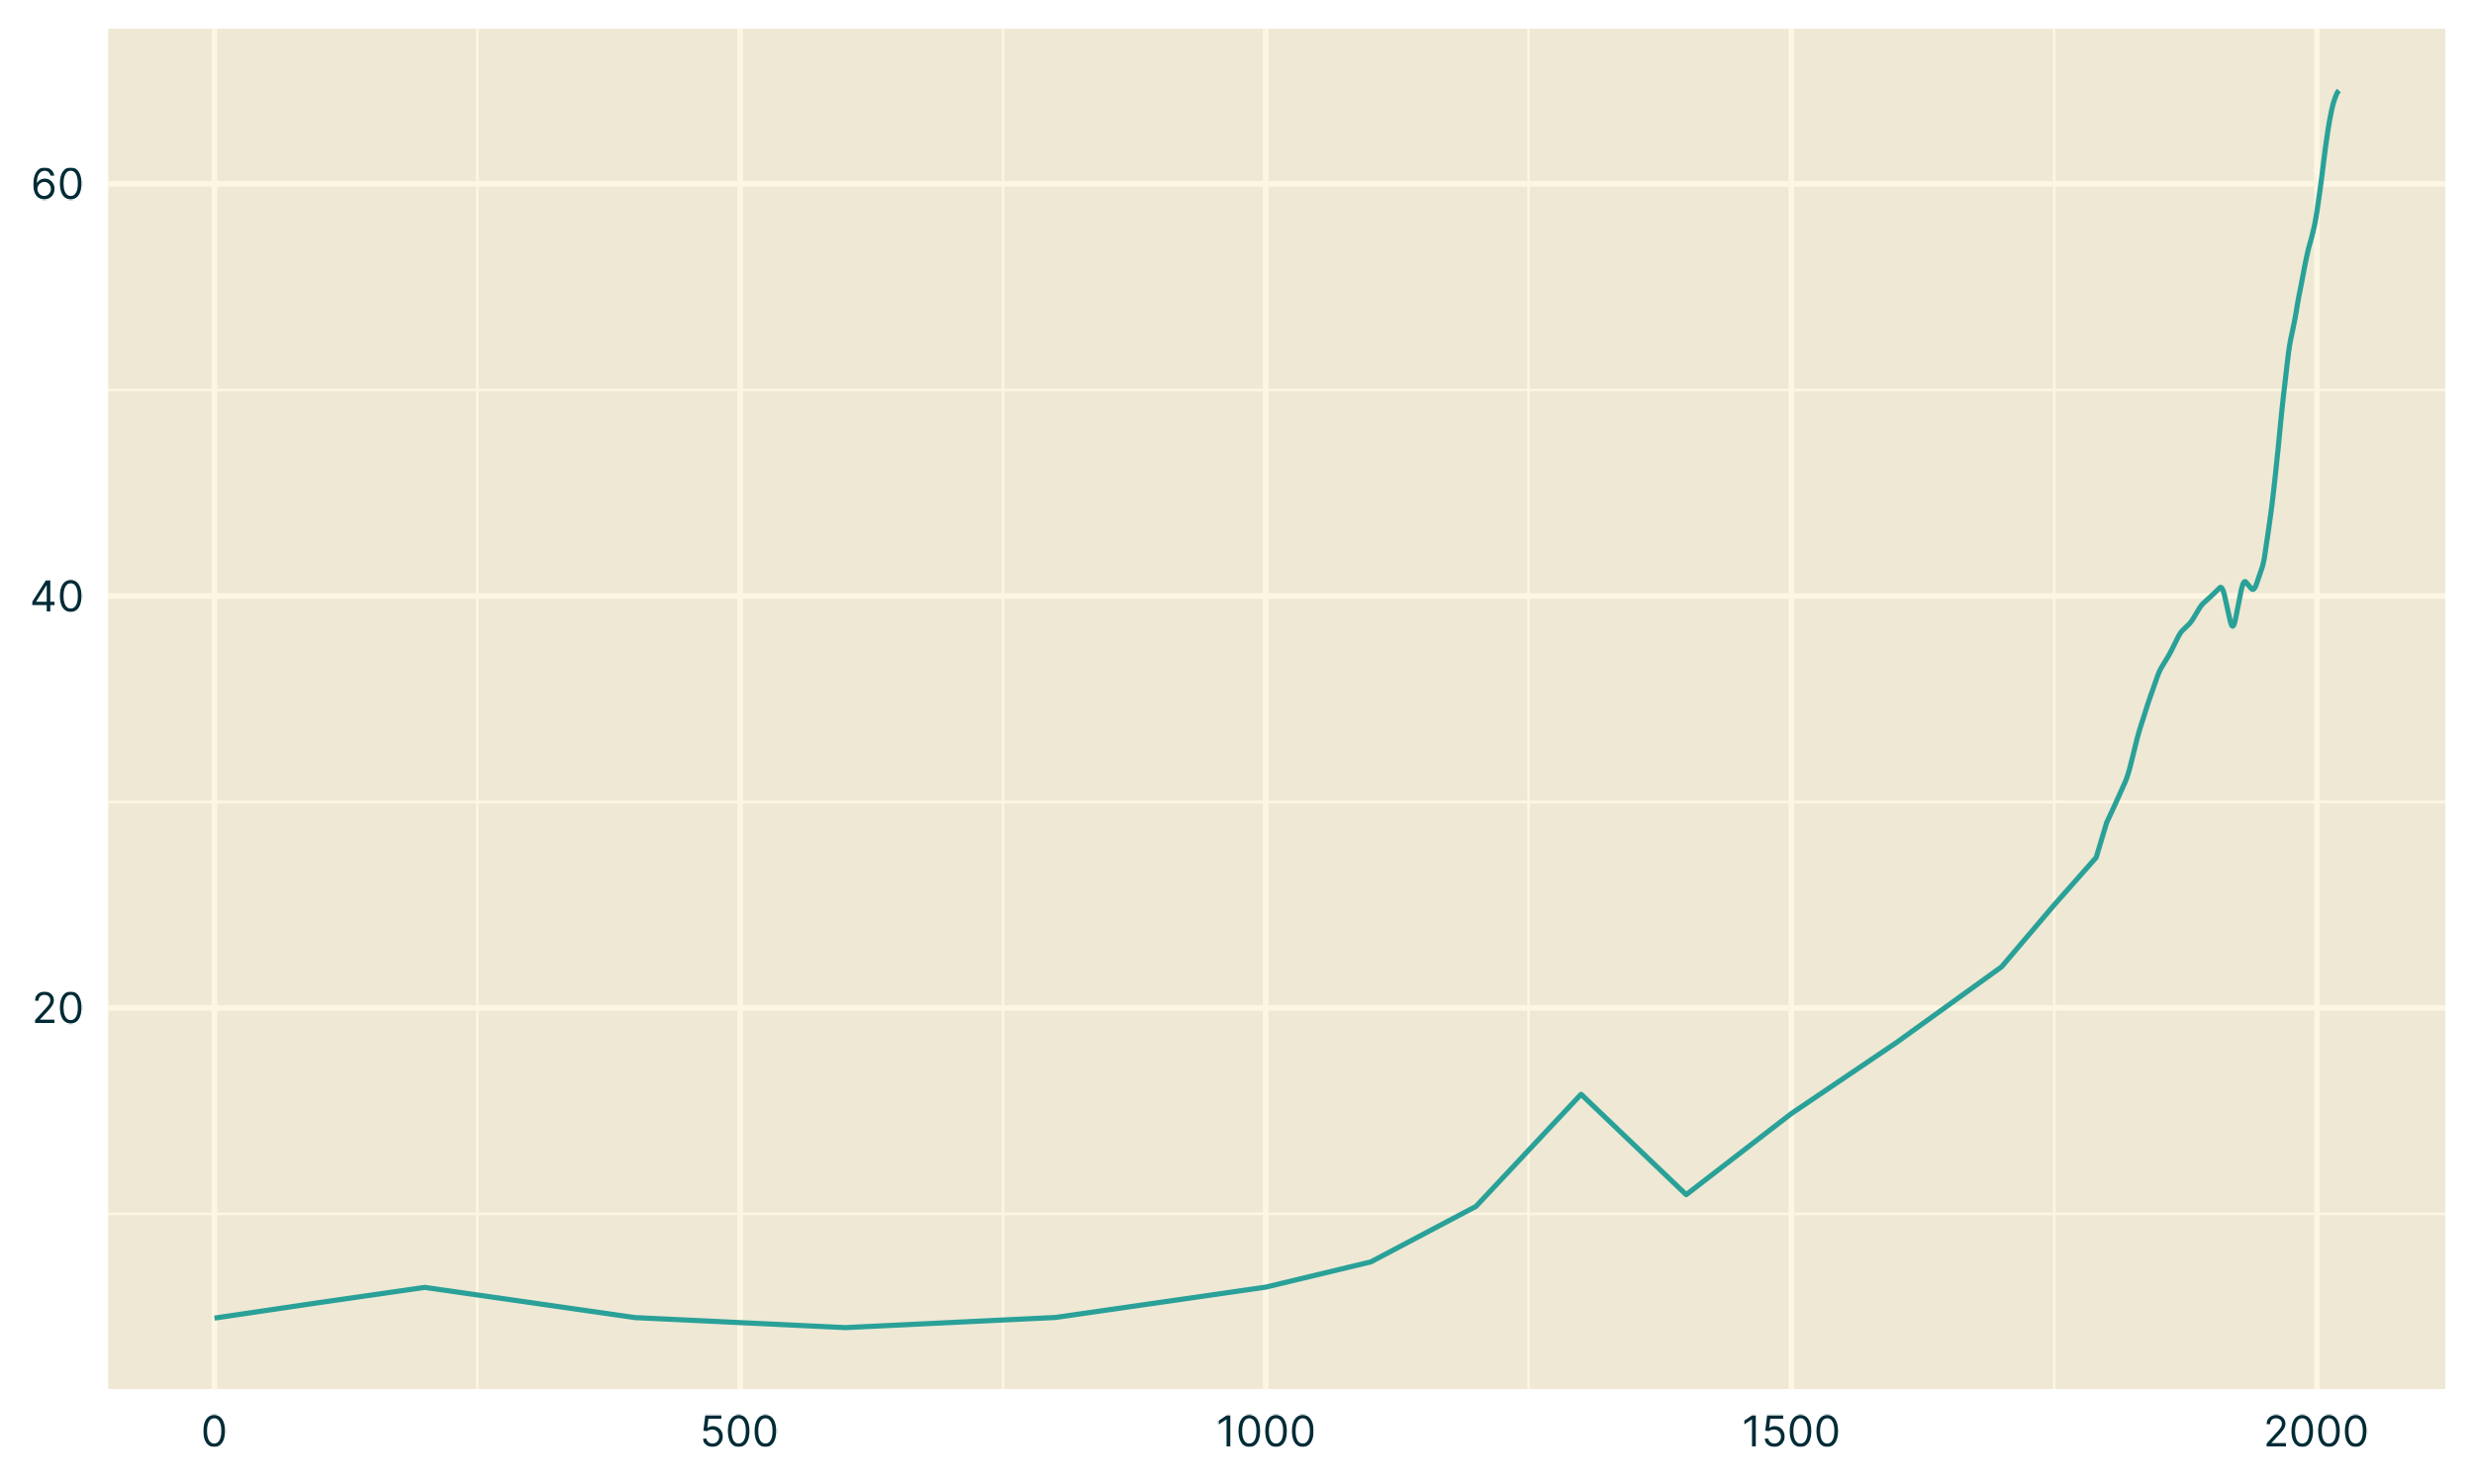
Can you identify the data represented on the plot?

Answer
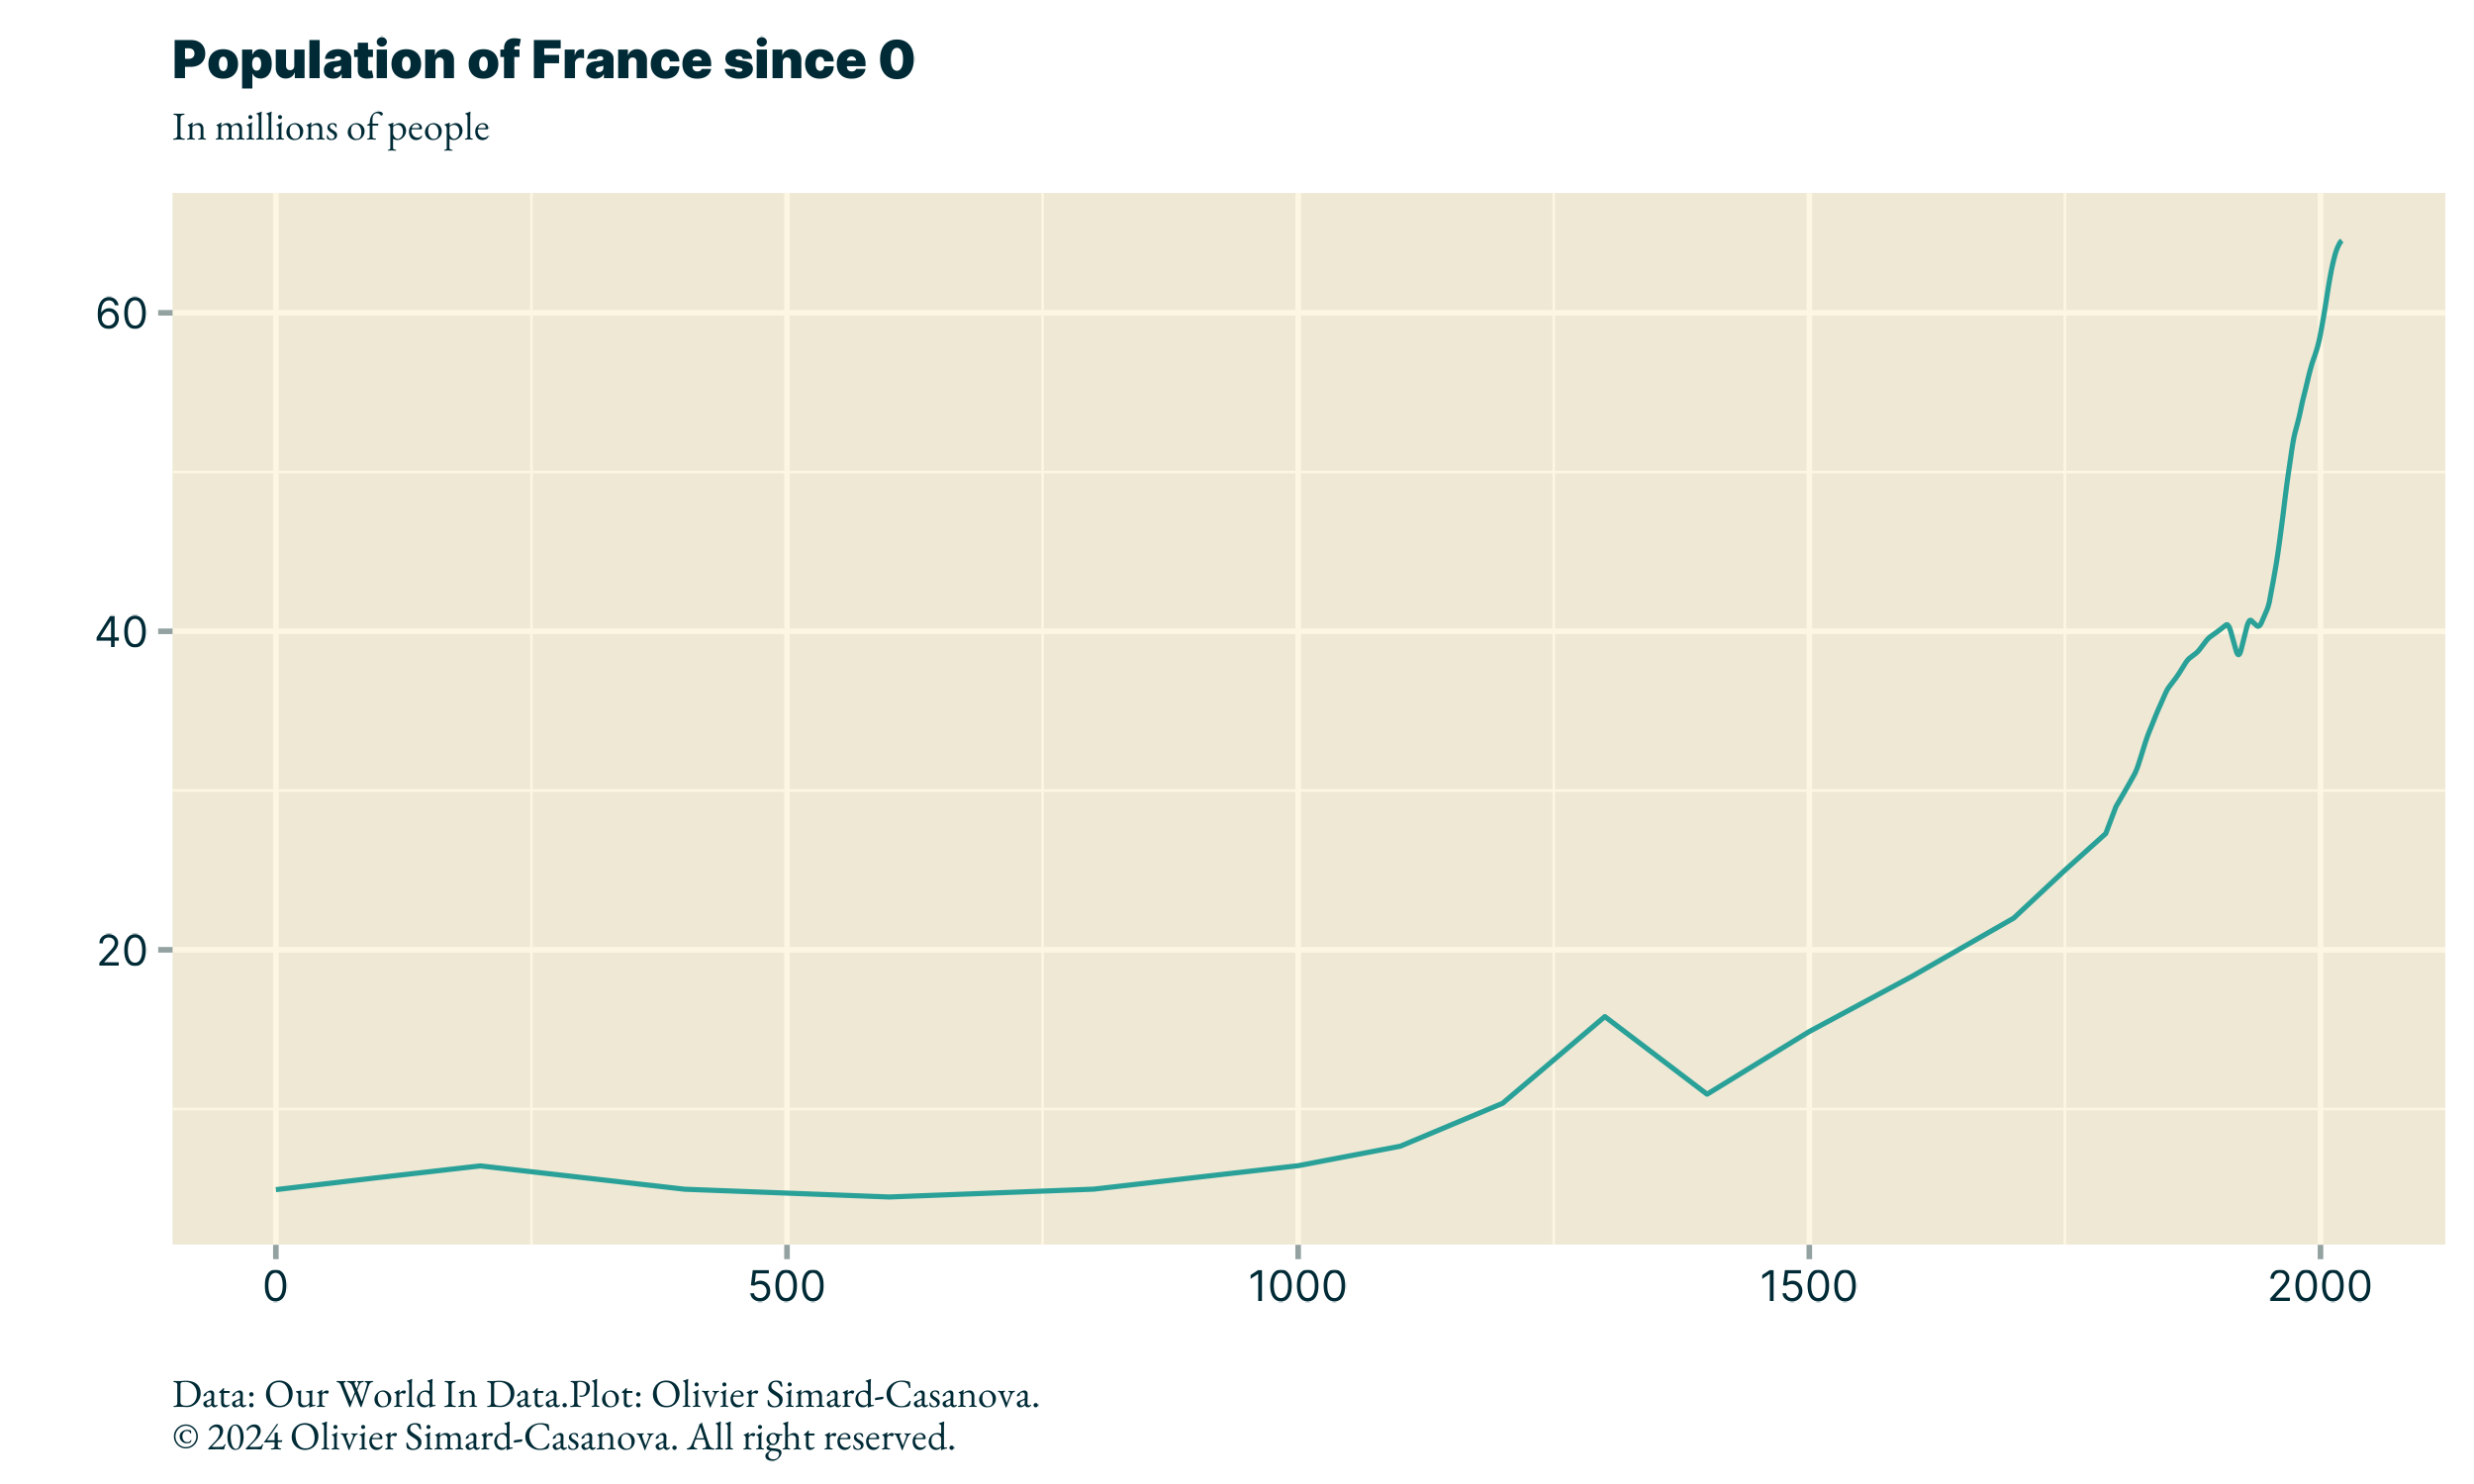
The plot represents the population of France since 0, in millions of people.

Can you identify the data represented on the plot?
The plot represents the population of France since 0, in millions of people.
Bluesky is becoming an increasingly appealing social media platform for a wide variety of economists

I am going back to academia

An illustration of the limits of aggregating data

Discover the features of version 1.86, a major update of the platform