
Guess The Plot #2
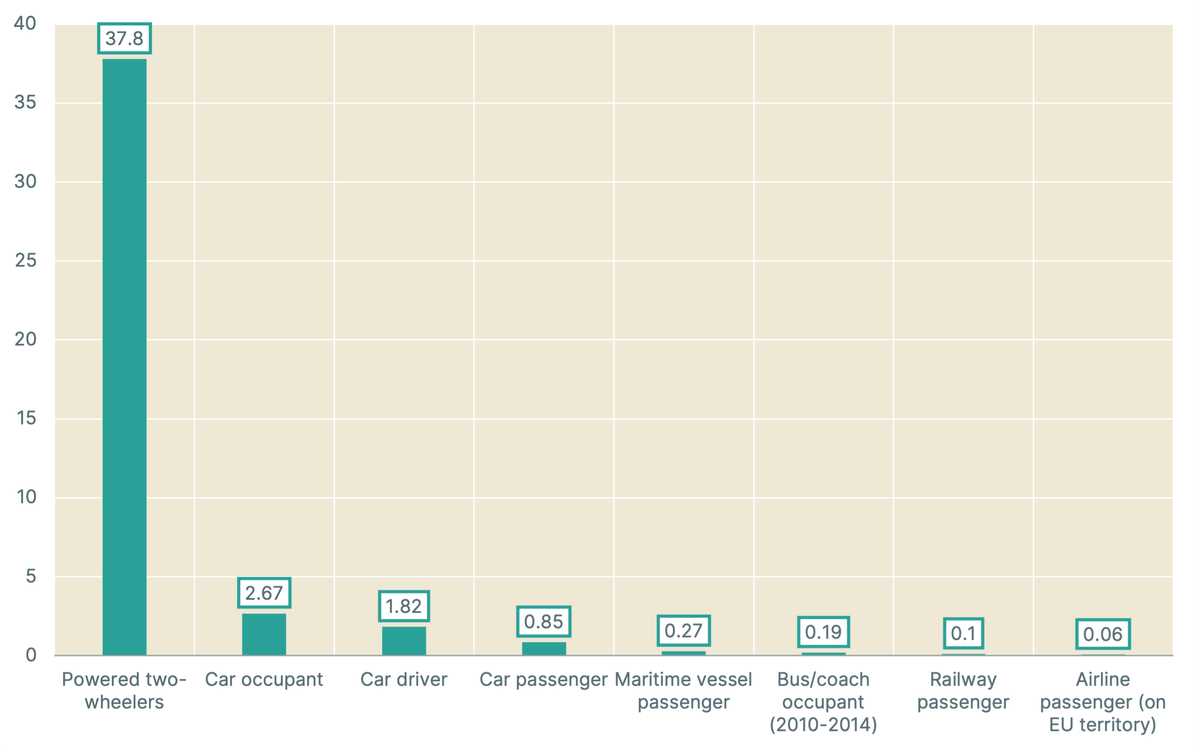
Can you identify the data represented on the plot?
Answer
The plot represents the risk of transportation modes in the European Union, measured in fatalities per billion passenger-kilometers (in the EU-27, during 2011-2015).
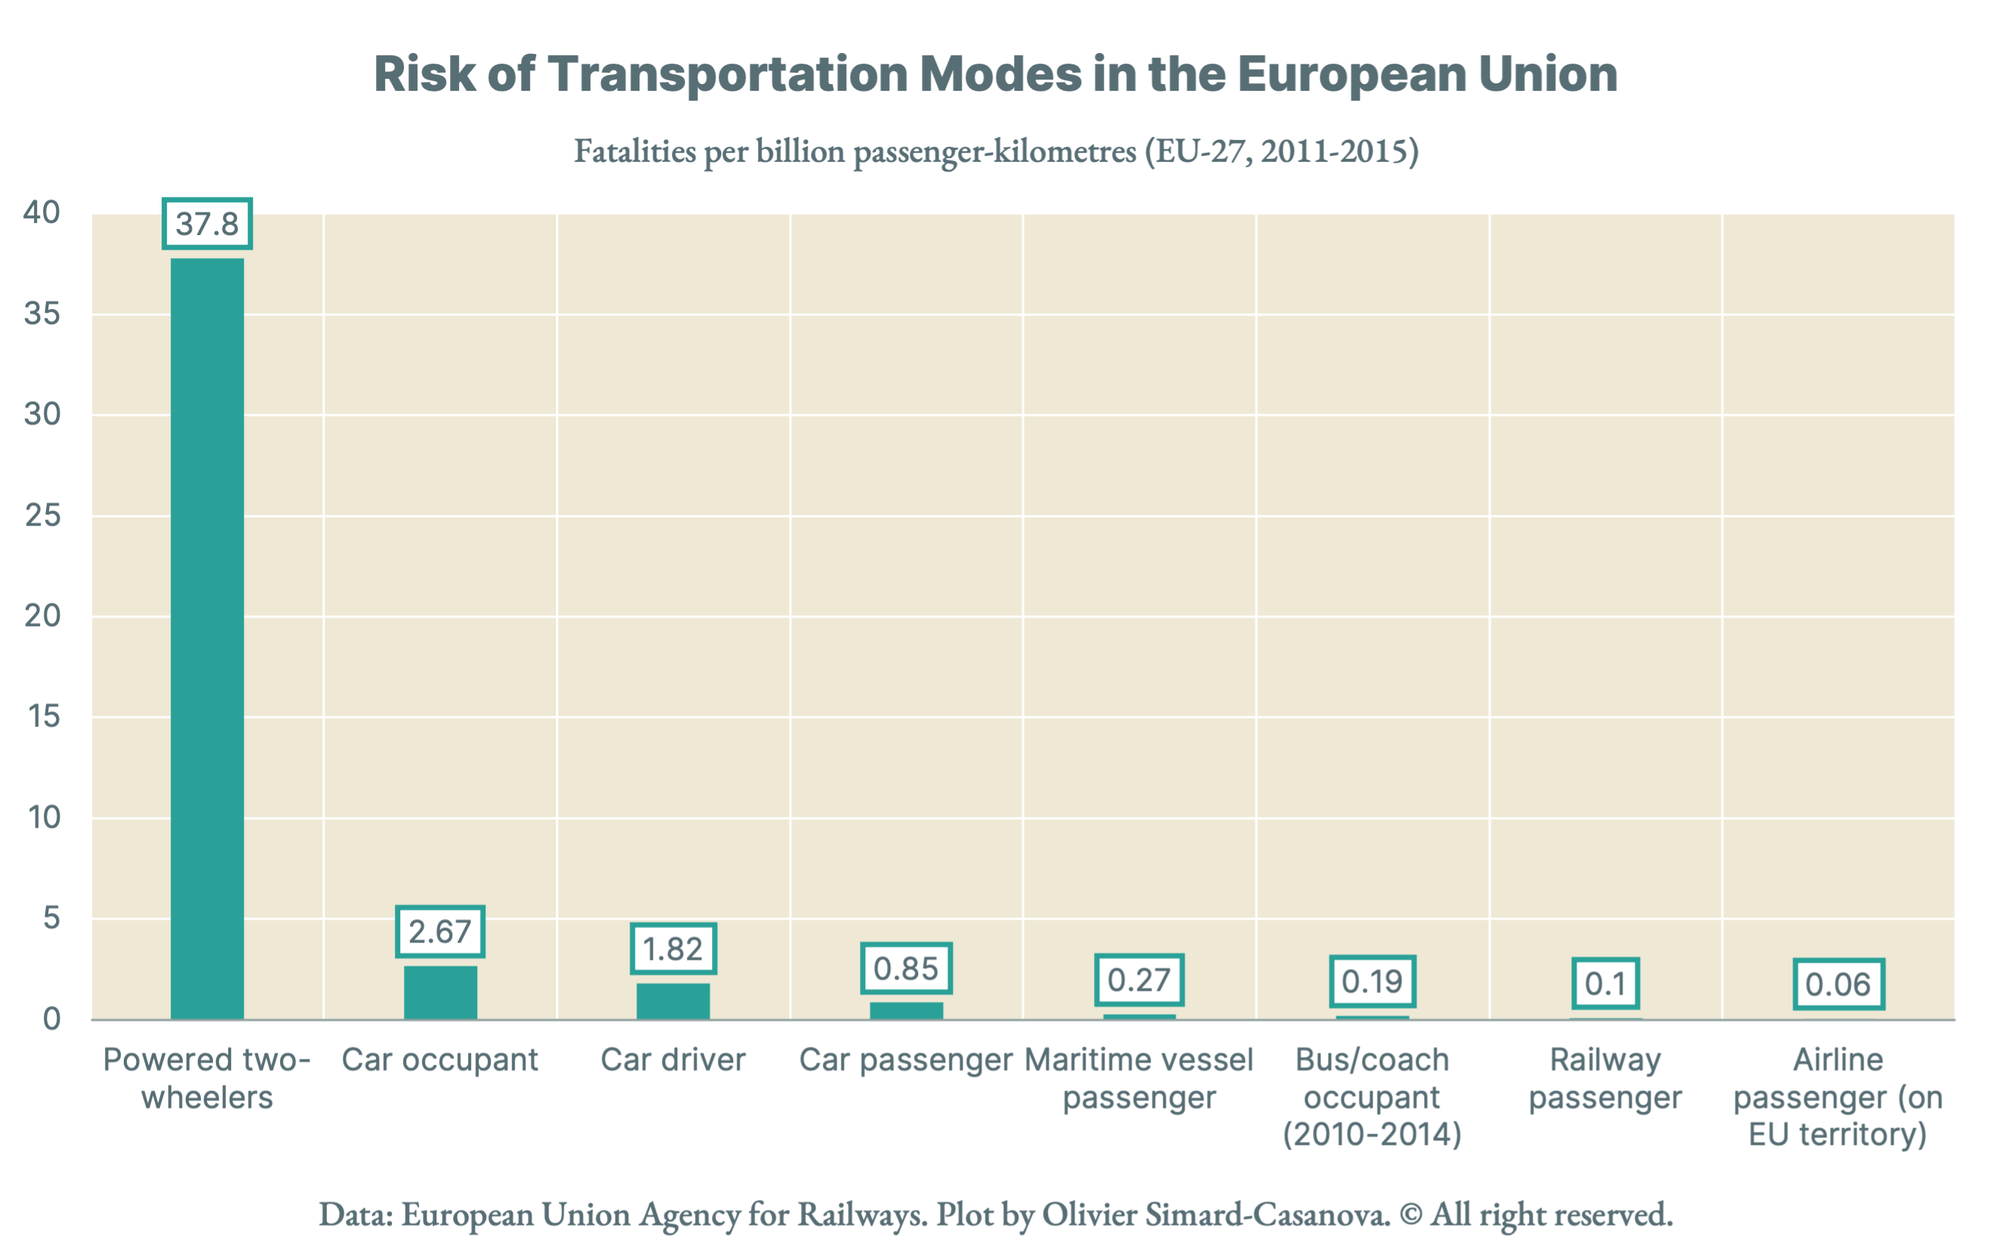
Can you identify the data represented on the plot?
The plot represents the risk of transportation modes in the European Union, measured in fatalities per billion passenger-kilometers (in the EU-27, during 2011-2015).


Comments ()