Guess The Plot #2
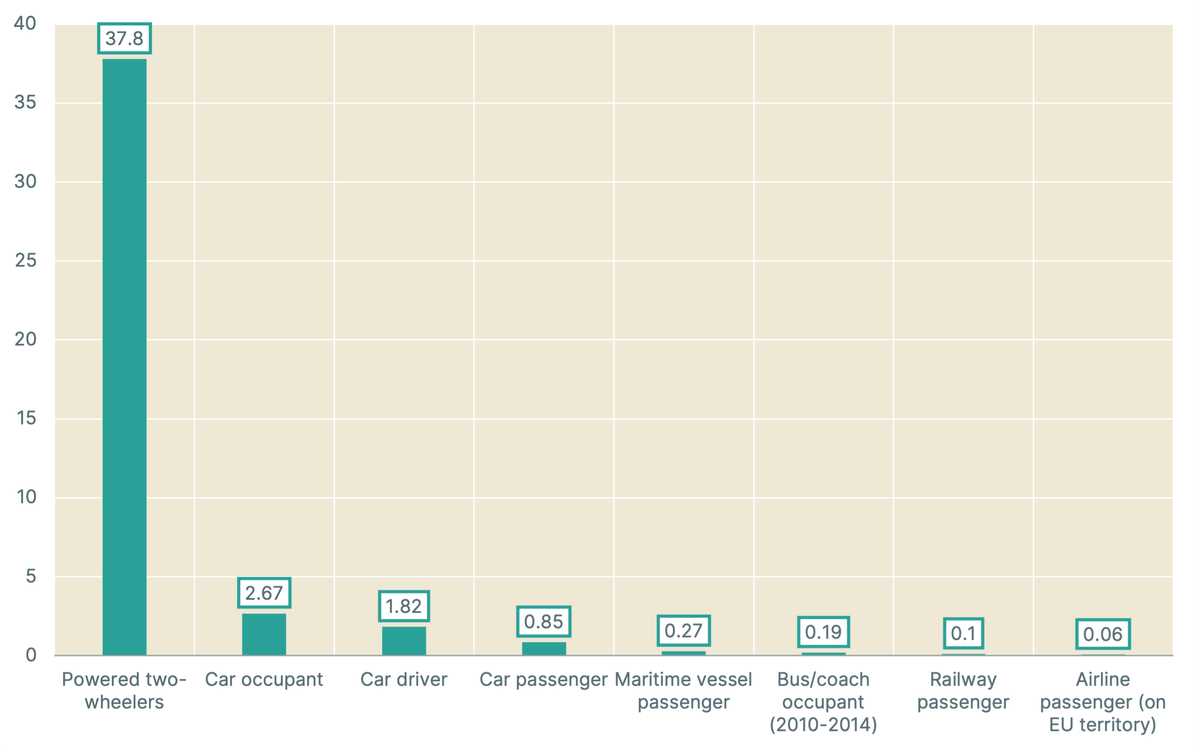
Can you identify the data represented on the plot?
Answer
The plot represents the risk of transportation modes in the European Union, measured in fatalities per billion passenger-kilometers (in the EU-27, during 2011-2015).
Can you identify the data represented on the plot?
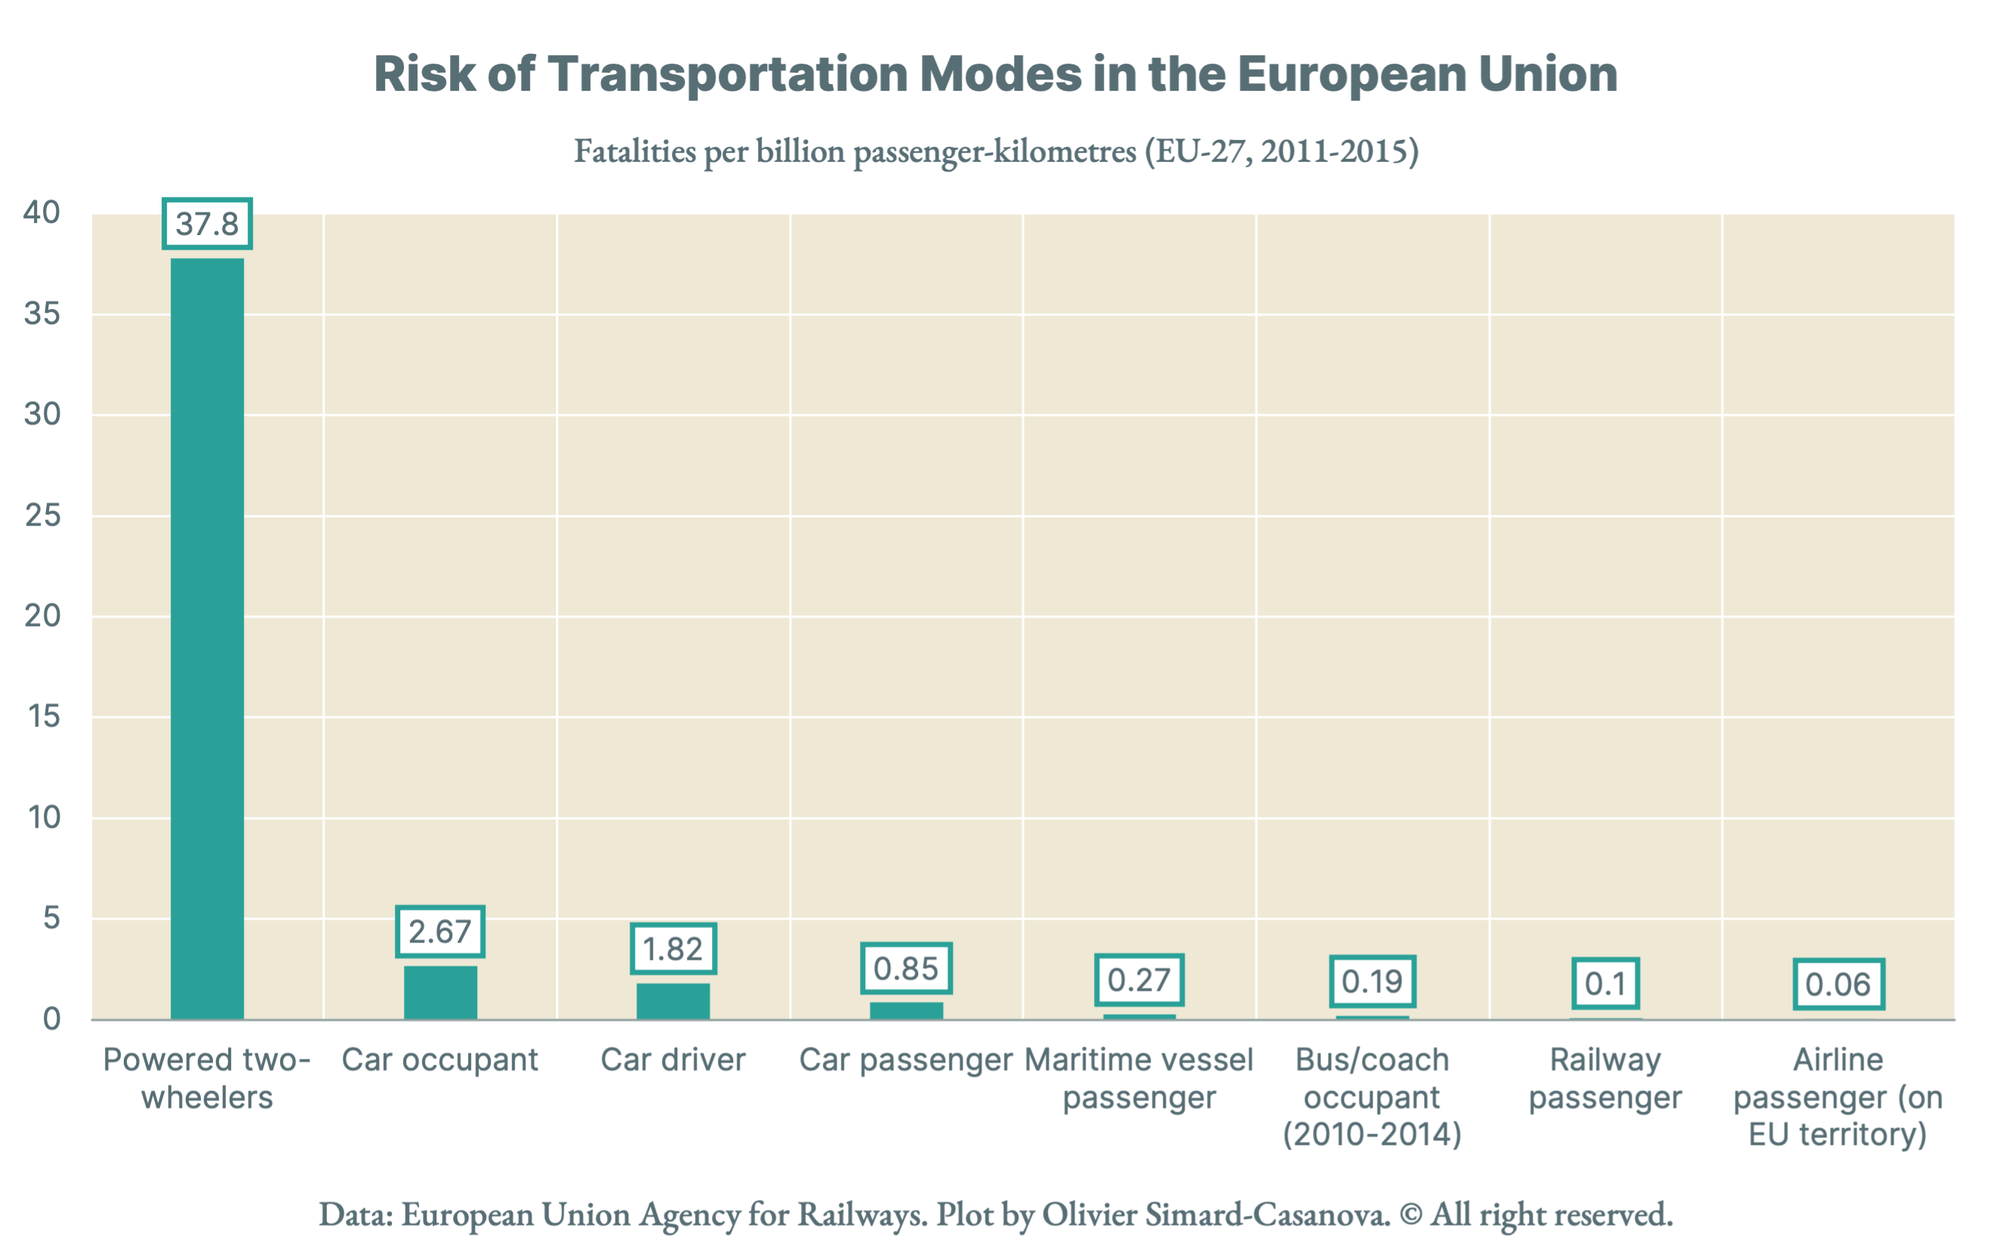
The plot represents the risk of transportation modes in the European Union, measured in fatalities per billion passenger-kilometers (in the EU-27, during 2011-2015).

I am going back to academia

An illustration of the limits of aggregating data

Discover the features of version 1.86, a major update of the platform

In fifty years, the price per Watt of solar photovoltaic power has fallen dramatically