
Guess The Plot #3
Can you identify the data represented on the plot?
Answer
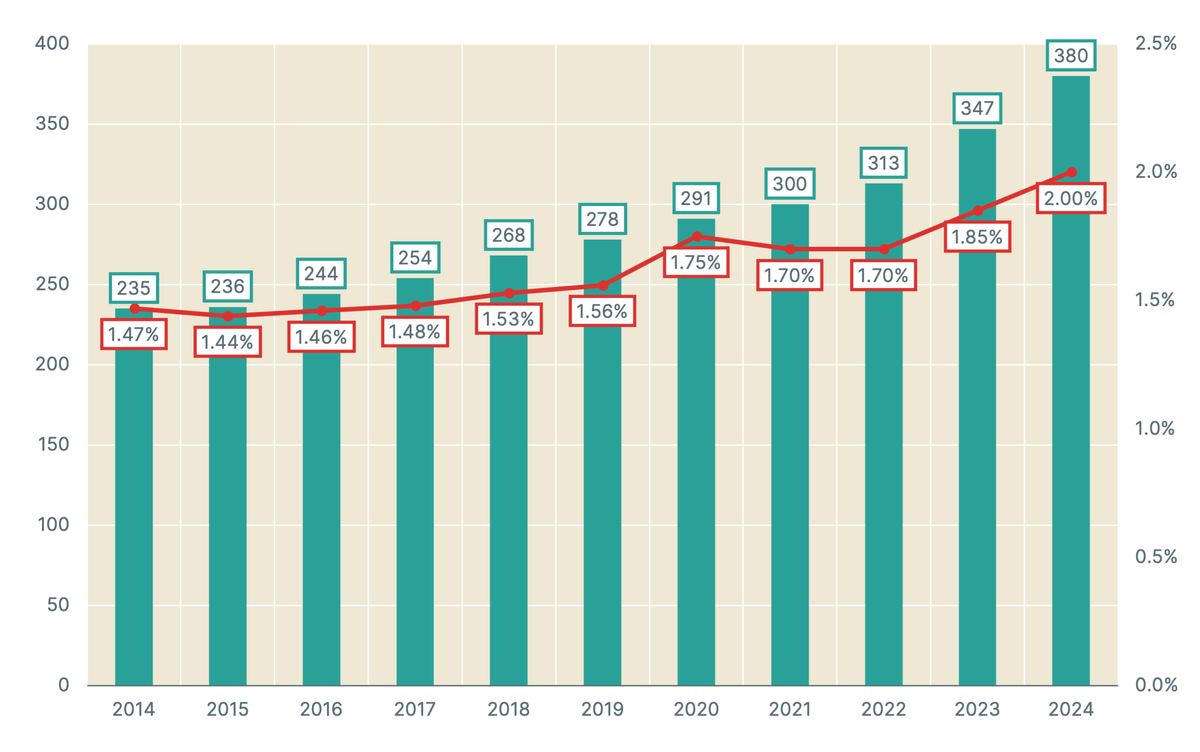
The plot represents defense expenditure of European NATO members, in absolute value (adjusted for inflation, bars) and as a share of GDP (curve).
Can you identify the data represented on the plot?
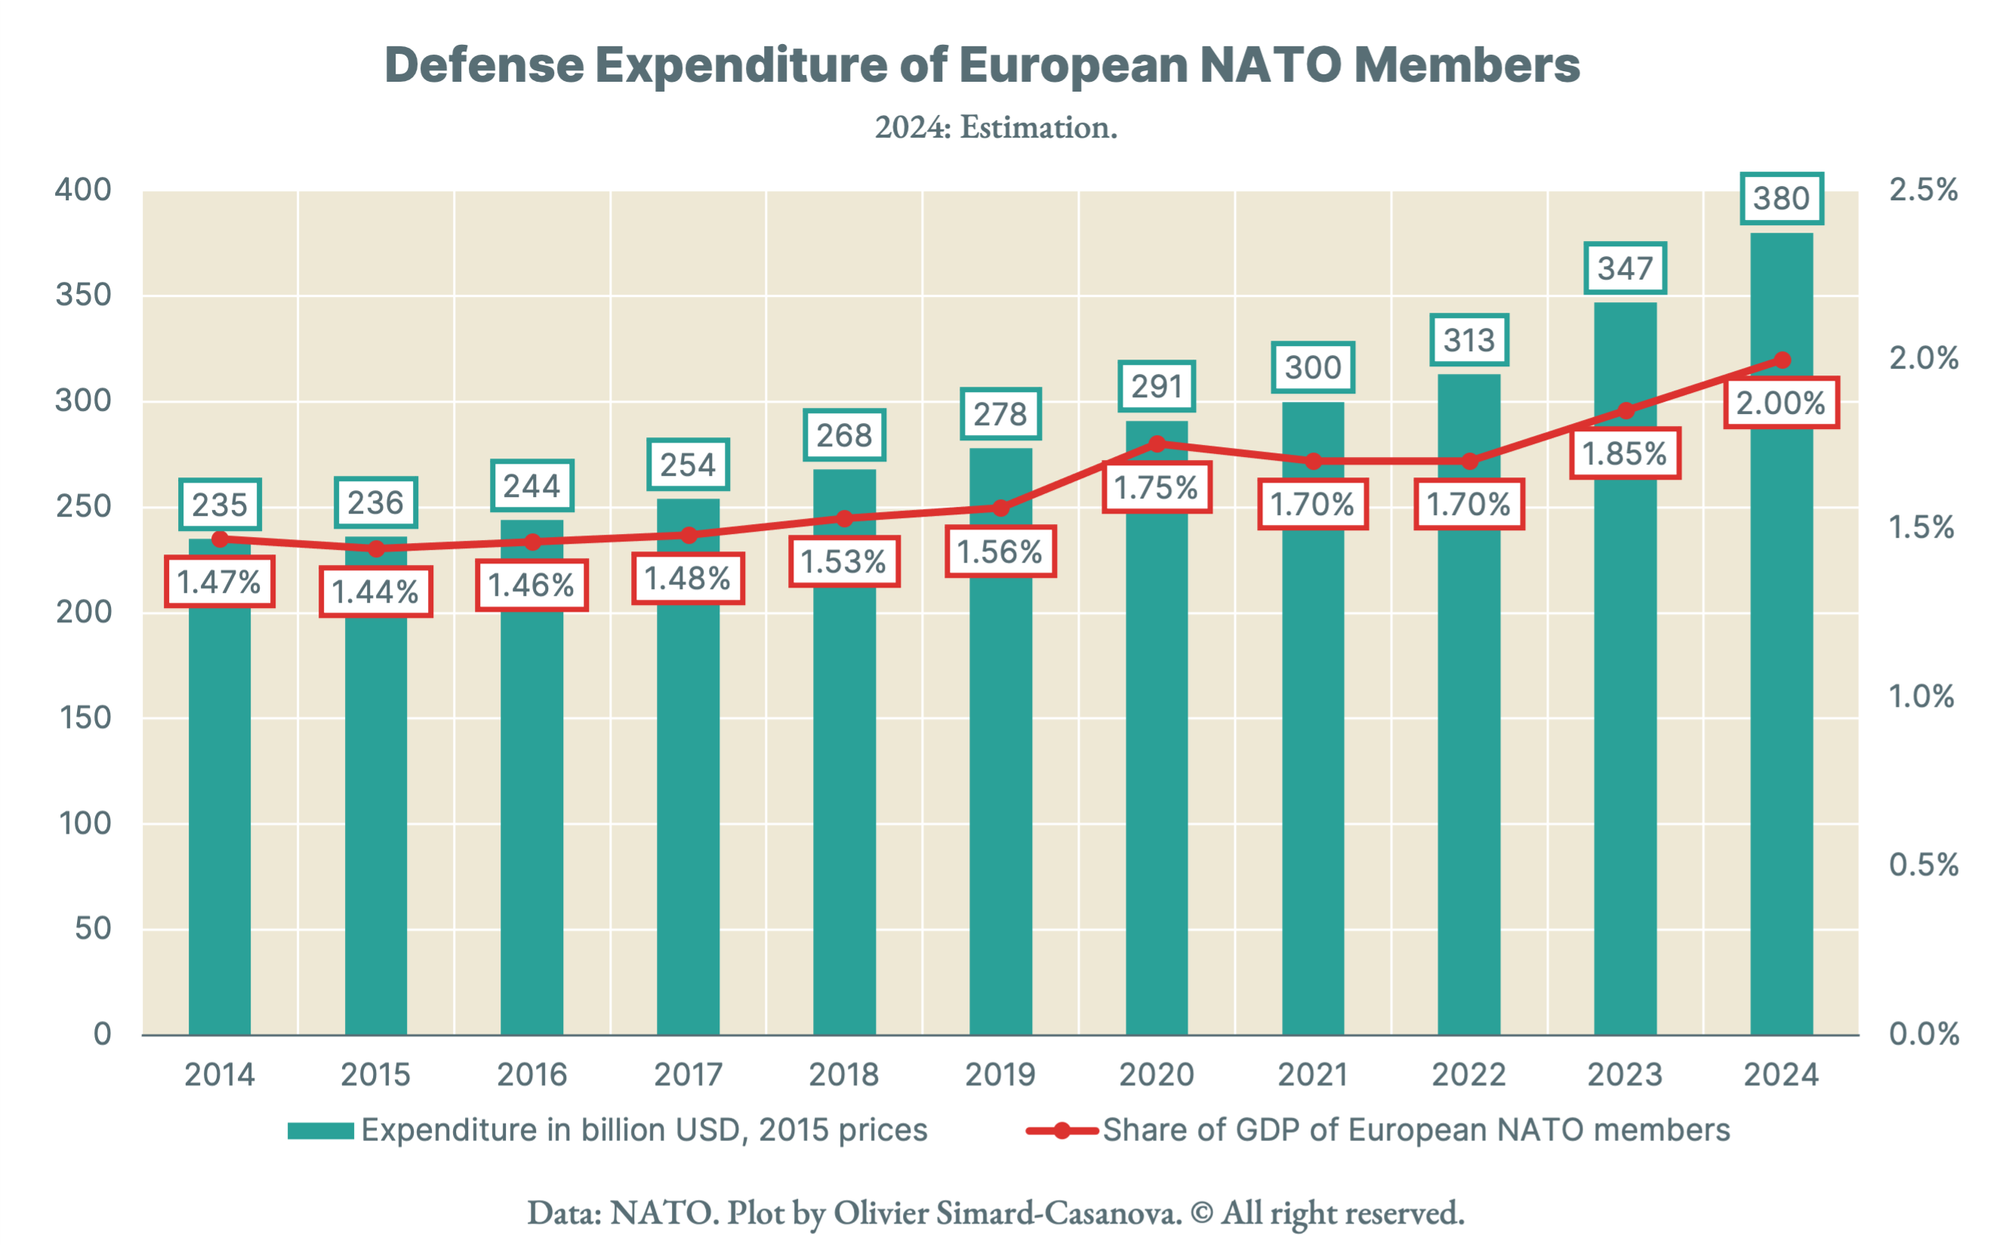
The plot represents defense expenditure of European NATO members, in absolute value (adjusted for inflation, bars) and as a share of GDP (curve).


Comments ()