Guess The Plot #3
Can you identify the data represented on the plot?
Answer
The plot represents defense expenditure of European NATO members, in absolute value (adjusted for inflation, bars) and as a share of GDP (curve).
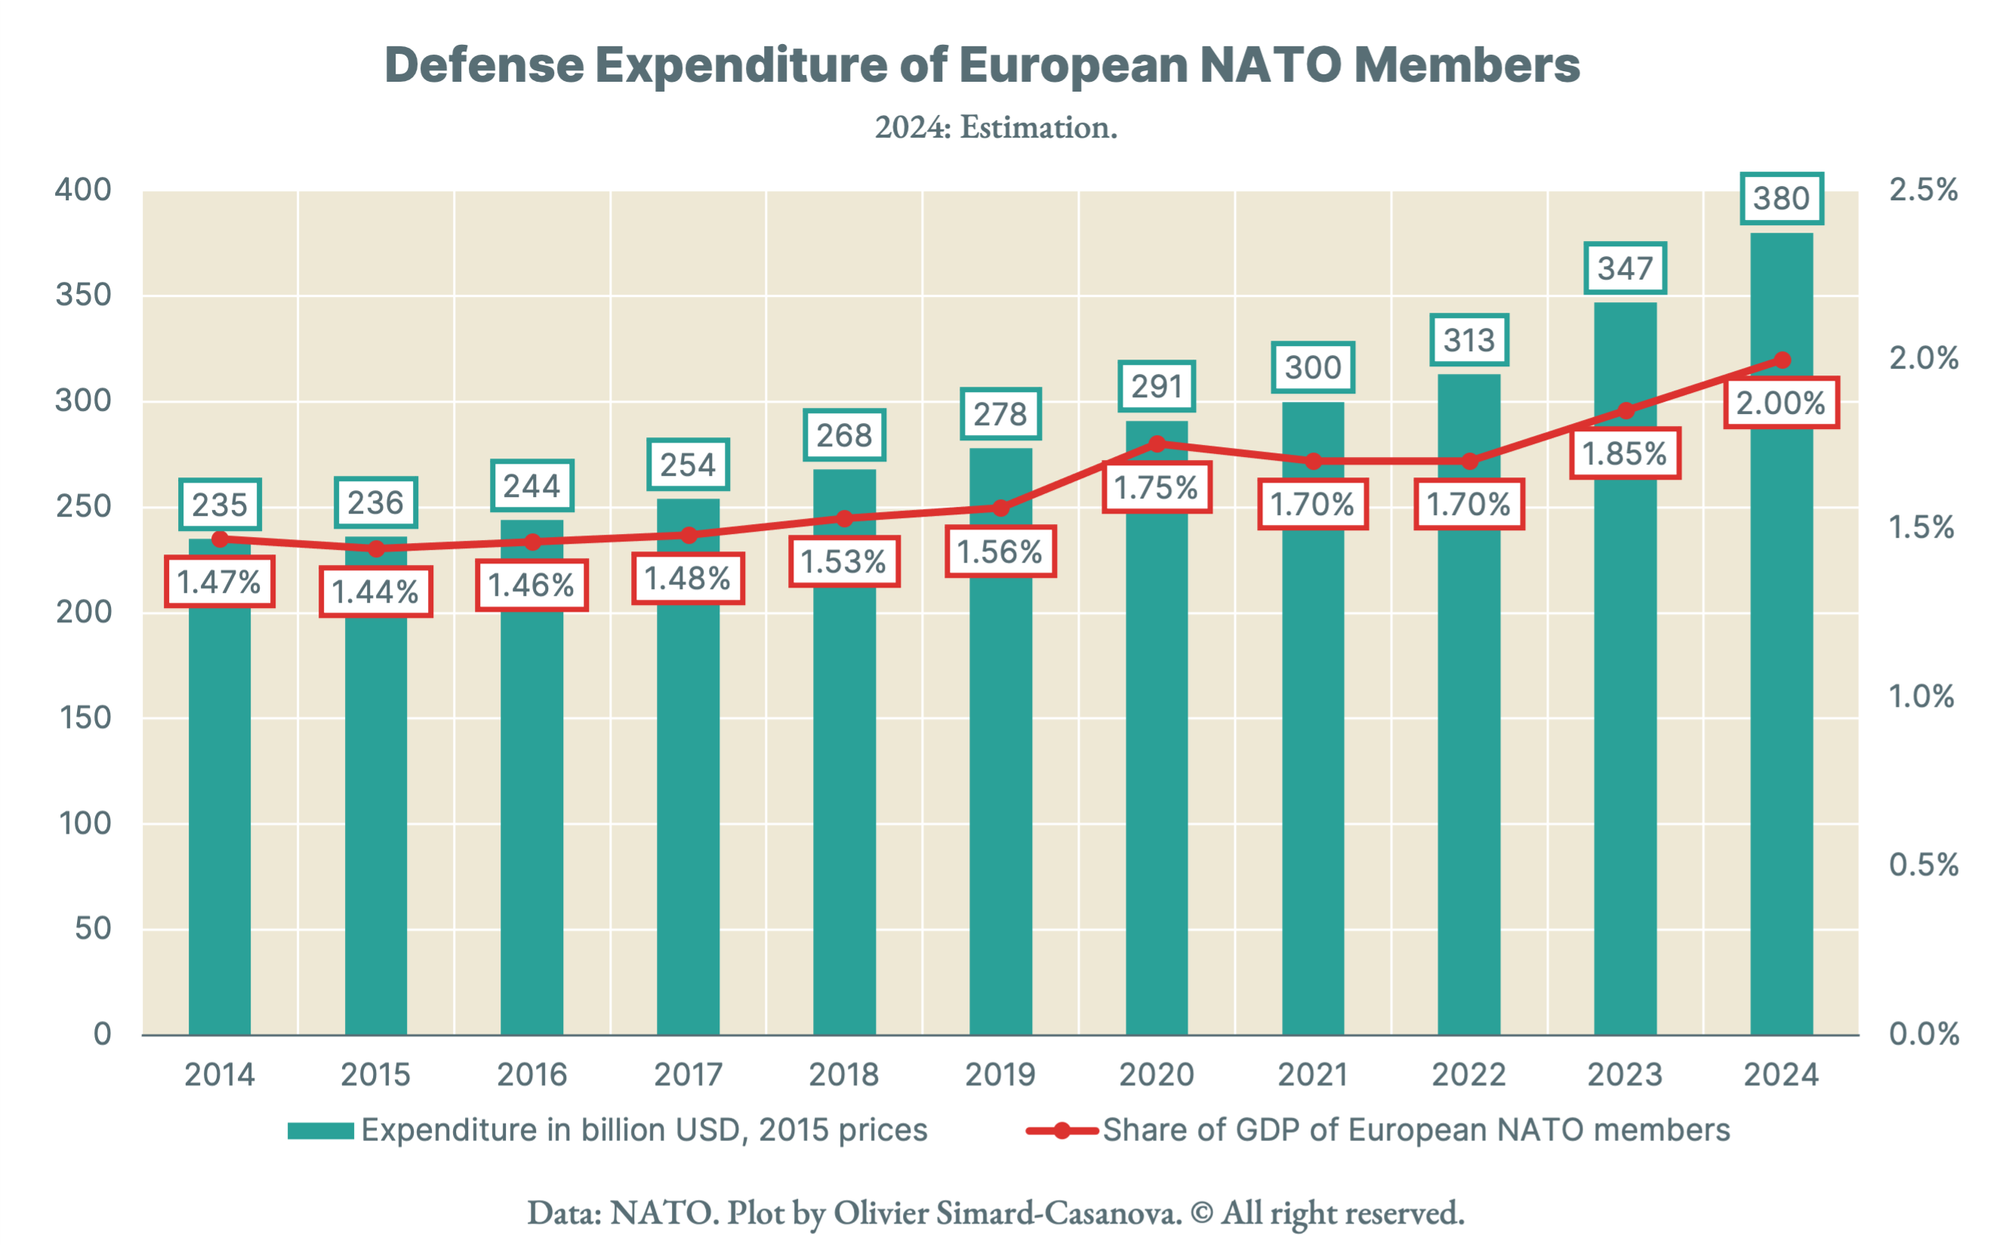
Can you identify the data represented on the plot?
The plot represents defense expenditure of European NATO members, in absolute value (adjusted for inflation, bars) and as a share of GDP (curve).

I am going back to academia

An illustration of the limits of aggregating data

Discover the features of version 1.86, a major update of the platform

In fifty years, the price per Watt of solar photovoltaic power has fallen dramatically